Appendix 1 – Noise Shapes | 43 |
|
|
Part 3
Appendix 1 – Noise Shapes
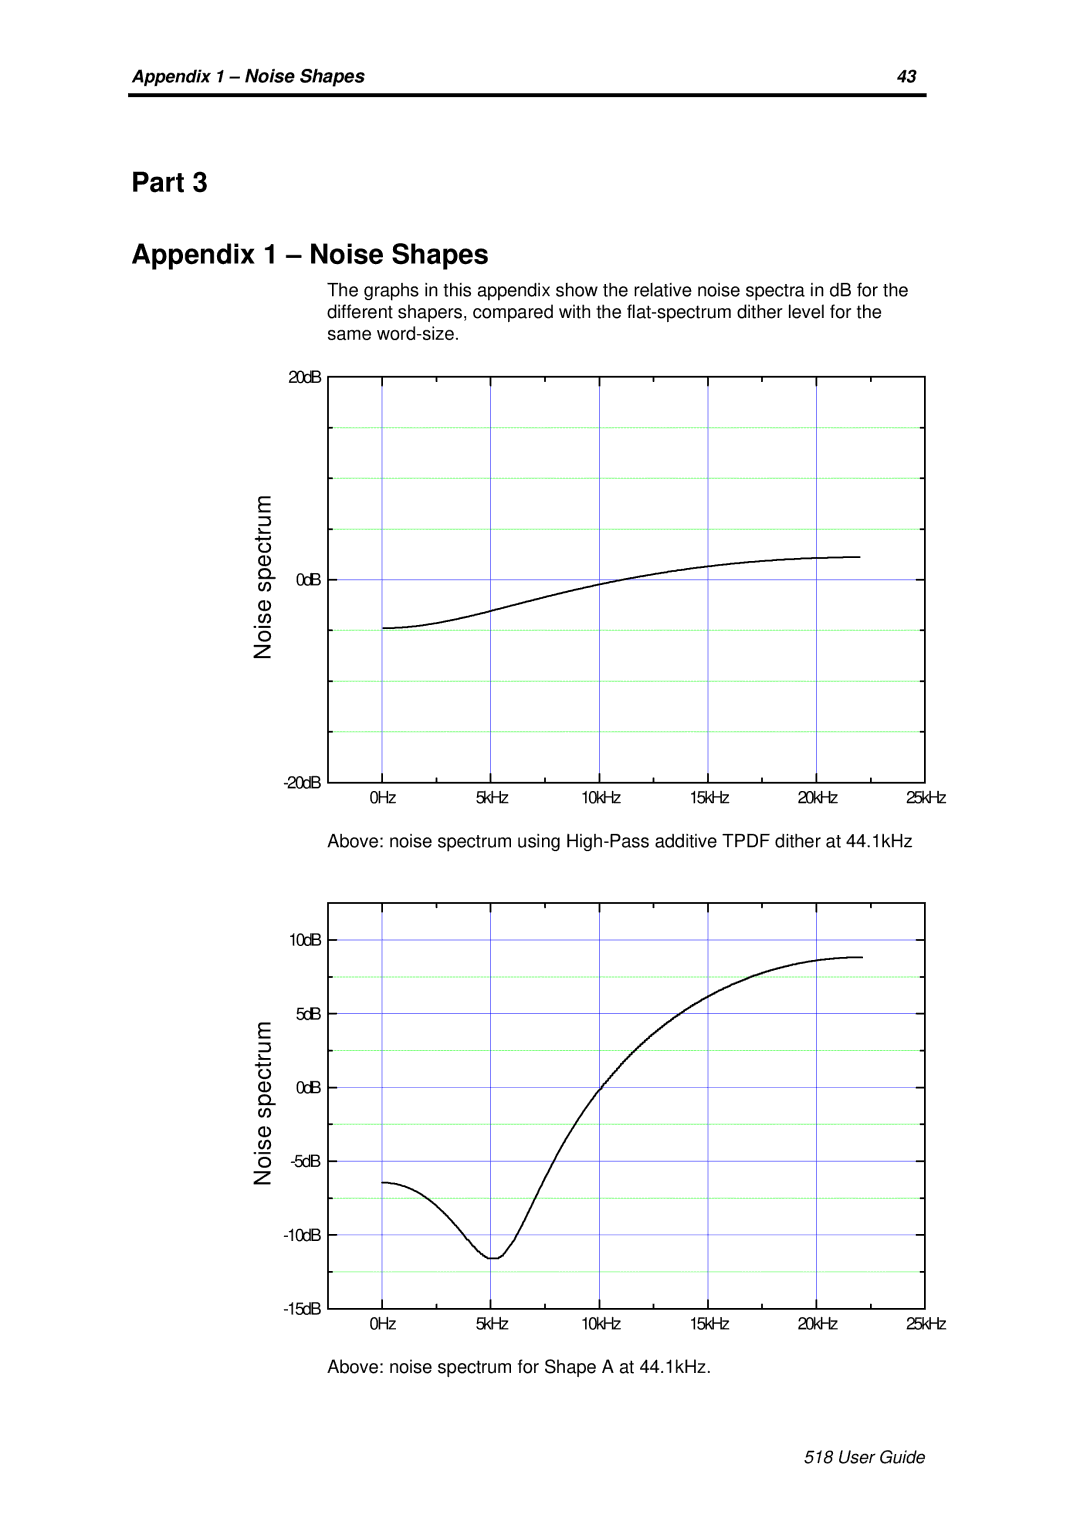
The graphs in this appendix show the relative noise spectra in dB for the different shapers, compared with the
Noise spectrum
20dB
0dB
0Hz | 5kHz | 10kHz | 15kHz | 20kHz | 25kHz |
Above: noise spectrum using
| 10dB |
|
|
|
|
|
spectrum | 5dB |
|
|
|
|
|
0dB |
|
|
|
|
| |
|
|
|
|
|
| |
Noise |
|
|
|
|
| |
|
|
|
|
|
| |
|
|
|
|
|
| |
| 5kHz | 10kHz | 15kHz | 20kHz | 25kHz | |
| 0Hz |
Above: noise spectrum for Shape A at 44.1kHz.
518 User Guide