Reference Manual for the ProSafe VPN Firewall FVS114
Trademarks
Statement of Conditions
EN 55 022 Declaration of Conformance
Certificate of the Manufacturer/Importer
Product and Publication Details
202-10098-01, April
Contents
Chapter Firewall Protection Content Filtering
Chapter Advanced Virtual Private Networking
Chapter Advanced Configuration
Appendix C Virtual Private Networking
Appendix D Preparing Your Network
Contents
Xii Contents
Chapter About This Manual
Audience, Scope, Conventions, and Formats
Typographical Conventions
Manual Scope
How to Use This Manual
How to Print this Manual
Printing a Page in the Html View
Printing a Chapter
Printing the Full Manual
Reference Manual for the ProSafe VPN Firewall FVS114
Key Features of the VPN Firewall
Chapter Introduction
Powerful, True Firewall with Content Filtering
Security
Autosensing Ethernet Connections with Auto Uplink
Extensive Protocol Support
Easy Installation and Management
Maintenance and Support
Package Contents
FVS114 Rear Panel
LED Descriptions
DC power input ON/OFF switch
NETGEAR-Related Products
Netgear Product Registration, Support, and Documentation
NETGEAR-Related Products
Reference Manual for the ProSafe VPN Firewall FVS114
Connecting the Firewall to the Internet
Prepare to Install Your FVS114 ProSafe VPN Firewall
First, Connect the FVS114
VPN Firewall
Modem
Restart Your Network in the Correct Sequence
Now, Configure the FVS114 for Internet Access
Status lights
Netgear Smart Wizard Configuration Assistant welcome screen
Troubleshooting Tips
Make sure the network settings of the computer are correct
Be sure to restart your network in this sequence
Make sure the Ethernet cables are securely plugged
Overview of How to Access the FVS114 VPN Firewall
Ways to access the firewall
Login URL
How to Bypass the Configuration Assistant
Login result FVS114 home
Using the Smart Setup Wizard
How to Manually Configure Your Internet Connection
ISP Does Not Require Login
Reference Manual for the ProSafe VPN Firewall FVS114
10 Basic Settings ISP list
Reference Manual for the ProSafe VPN Firewall FVS114
Chapter Firewall Protection Content Filtering
Firewall Protection and Content Filtering Overview
Block Sites
Block Sites menu
Using Rules to Block or Allow Specific Kinds of Traffic
Rules menu
Reference Manual for the ProSafe VPN Firewall FVS114
Inbound Rules Port Forwarding
Inbound Rule Example a Local Public Web Server
Rule example a local public Web server
Outbound Rules Service Blocking
Considerations for Inbound Rules
Outbound Rule Example Blocking Instant Messenger
Rule example blocking Instant Messenger
Order of Precedence for Rules
Rules table
Services
Services menu
Add Custom Service menu
Using a Schedule to Block or Allow Specific Traffic
Schedule
Time Zone
Getting E-Mail Notifications of Event Logs and Alerts
10 E-mail menu
Reference Manual for the ProSafe VPN Firewall FVS114
Viewing Logs of Web Access or Attempted Web Access
11 Logs menu
Syslog
Log entries are described in Table
Log action buttons are described in Table
Log entry descriptions
Chapter Basic Virtual Private Networking
VPN Tunnel
Single
Advanced methods see , Advanced Virtual Private Networking
Configuration
VPN Tunnel
Configuring the Client-to-Gateway VPN Tunnel on the FVS114
VPN Wizard start screen
Summary screen below displays
Connection Name and Remote IP Type
Vpnc Recommended Settings
Configuring the Netgear ProSafe VPN Client on the Remote PC
Select Secure in the Connection Security check box
Security Policy Editor new connection
11 Security Policy Editor Security Policy
12 Security Policy Editor My Identity
13 Security Policy Editor Pre-Shared Key
15 Security Policy Editor Key Exchange
16 Running a Ping test to the LAN from the PC
18 Log Viewer screen
Transferring a Security Policy to Another Client
Exporting a Security Policy
Select Export Security Policy from the File pulldown
Importing a Security Policy
Select the security policy to import
Scenario1
FVS114 VPN Firewall PCs
Procedure to Configure a Gateway-to-Gateway VPN Tunnel
23 VPN Wizard start screen
25 Remote IP
27 VPN Wizard Summary
28 VPN Recommended Settings
30 VPN Status/Log screen
Start Using a VPN Tunnel to Activate It
Using the VPN Status Page to Activate a VPN Tunnel
VPN Tunnel Control
Activating a VPN Tunnel
Activate the VPN Tunnel by Pinging the Remote Endpoint
32 VPN Status/Log screen
Type ping -t 192.168.3.1 and then click OK
Type ping
Verifying the Status of a VPN Tunnel
36 Pinging test results
Deactivating a VPN Tunnel
38 Current VPN Tunnels SAs screen
Using the VPN Status Page to Deactivate a VPN Tunnel
39 VPN Policies
Deleting a VPN Tunnel
41 Current VPN Tunnels SAs screen
Virtual Private
Using Policies to Manage VPN Traffic
Using Automatic Key Management
IKE Policies’ Automatic Key and Authentication Management
IKE Policy Configuration Menu
IKE Policy Configuration fields
Field Description General
VPN Policy Configuration for Auto Key Negotiation
Field Description Remote
VPN Auto Policy menu
VPN Auto Policy Configuration Fields
VPN Auto Policy fields are defined in the following table
Authenticating Header AH
VPN Policy Configuration for Manual Key Exchange
Netbios Enable
VPN Manual Policy menu
VPN Manual Policy Configuration Fields
VPN Manual Policy fields are defined in the following table
Value in its Authentication Algorithm Key Out field
Netbios Enable
Walk-Through of Configuration Scenarios on the FVS114
Certificate Revocation List CRL
VPN Consortium Scenario
From Settings menu
Are IPv4
WAN IP addresses
FVS114 Internet IP Address menu
LAN IP Setup menu
Set up the IKE Policy illustrated below on the FVS114
Scenario 1 IKE Policy
Set up the FVS114 VPN -Auto Policy illustrated below
10 Scenario 1 VPN Auto Policy
How to Check VPN Connections
Testing the Gateway a FVS114 LAN and the Gateway B LAN
Install the trusted CA certificate for the Trusted Root CA
FVS114 Scenario 2 FVS114 to FVS114 with RSA Certificates
Obtain a root certificate
Create a certificate request for the FVS114
11 Generate Self Certificate Request menu
Highlight, copy and paste this data into a text file
12 Self Certificate Request data
Click the Upload Certificate button
13 Self Certificate Requests table
14 Self Certificates table
Set up Certificate Revocation List CRL checking
Reference Manual for the ProSafe VPN Firewall FVS114
Chapter Maintenance
Viewing VPN Firewall Status Information
This screen shows the following parameters
FVS114 Status fields
Click Show WAN Status to display the WAN connection status
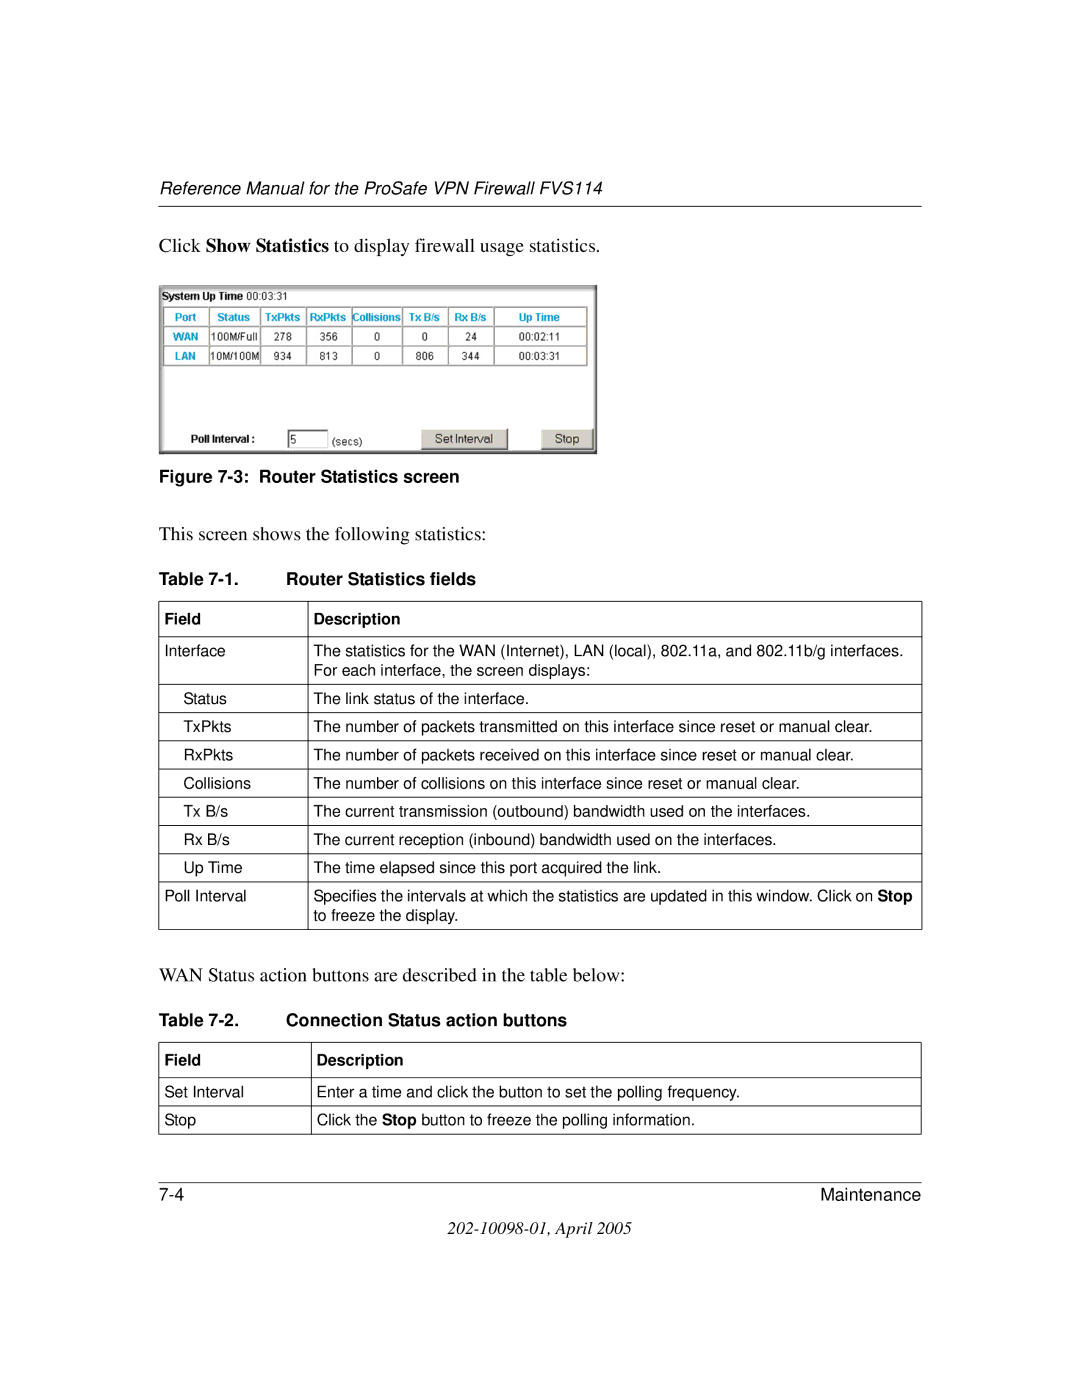
This screen shows the following statistics
Connection Status fields
Connection Status action buttons
Click Show Statistics to display firewall usage statistics
WAN Status action buttons are described in the table below
Router Statistics fields
Viewing a List of Attached Devices
Upgrading the Firewall Software
Configuration File Management
Router Upgrade menu
Backing Up the Configuration
Restoring the Configuration
Erasing the Configuration
Changing the Administrator Password
Diagnostics
Diagnostics menu
Ping or Trace an IP address
Reference Manual for the ProSafe VPN Firewall FVS114
Chapter Advanced Configuration
WAN Setup
Default DMZ Server
How to Configure Dynamic DNS
To assign a computer or server to be a Default DMZ server
Click Default DMZ Server
Respond to Ping on Internet WAN Port
Dynamic DNS
Using the LAN IP Setup Options
Configuring LAN TCP/IP Setup Parameters
Reference Manual for the ProSafe VPN Firewall FVS114
Using the Firewall as a Dhcp server
Using Address Reservation
Configuring Static Routes
Click Edit or Delete
Static Routes table
Enabling Remote Management Access
Static Route Example
Remote Management menu
Https//134.177.0.1238080
UPnP
UPnP menu
Reference Manual for the ProSafe VPN Firewall FVS114
Chapter Troubleshooting
Power LED Not On
Basic Functioning
LEDs Never Turn Off
LAN or Internet Port LEDs Not On
Troubleshooting the Web Configuration Interface
Troubleshooting the ISP Connection
Troubleshooting a TCP/IP Network Using a Ping Utility
Testing the LAN Path to Your Firewall
Testing the Path from Your PC to a Remote Device
If the path is working, you see this message
If the path is not working, you see this message
Ping -n 10 IP address
Restoring the Default Configuration and Password
Problems with Date and Time
Reference Manual for the ProSafe VPN Firewall FVS114
Appendix a Technical Specifications
Data and Routing Protocols
PPP over Ethernet PPPoE
Interface Specifications
10BASE-T or 100BASE-Tx, RJ-45
Electromagnetic Emissions
Appendix B Network, Routing, and Firewall Basics
Related Publications Basic Router Concepts
What is a Router?
IP Addresses and the Internet
Routing Information Protocol
Is normally written as
Figure B-1 Three Main Address Classes
Netmask
Combined with
Equals
Subnet Addressing
Figure B-2 Example of Subnetting a Class B Address
Table B-1 Netmask notation translation table for one octet
Table B-2. Netmask formats
Private IP Addresses
Table B-2 Netmask formats
Single IP Address Operation Using NAT
Figure B-3 Single IP Address Operation Using NAT
MAC Addresses and Address Resolution Protocol
Related Documents
Domain Name Server
IP Configuration by Dhcp
Internet Security and Firewalls
What is a Firewall?
Denial of Service Attack
Ethernet Cabling
Stateful Packet Inspection
Table B-3 UTP Ethernet cable wiring, straight-through
Category 5 Cable Quality
Inside Twisted Pair Cables
Figure B-4illustrates straight-through twisted pair cable
Uplink Switches, Crossover Cables, and MDI/MDIX Switching
Reference Manual for the ProSafe VPN Firewall FVS114
Reference Manual for the ProSafe VPN Firewall FVS114
What is a VPN?
Appendix C Virtual Private Networking
What Is IPSec and How Does It Work?
IPSec Security Features
IPSec Components
IPSec contains the following elements
Encapsulating Security Payload ESP
Authentication Header AH
IKE Security Association
Mode
Understand the Process Before You Begin
Key Management
VPN Process Overview
Addresses
It functions as a
VPN Tunnel Between Gateways
Firewalls
Table C-2 Subnet addressing
IPSec Security Association IKE VPN Tunnel Negotiation Steps
IPSec Security Association SA negotiation
Vpnc IKE Phase I Parameters
Vpnc IKE Security Parameters
Testing and Troubleshooting
Vpnc IKE Phase II Parameters
Additional Reading
Relevant RFCs listed numerically
Appendix D Preparing Your Network
Preparing Your Computers for TCP/IP Networking
Configuring Windows 95, 98, and Me for TCP/IP Networking
Install or Verify Windows Networking Components
Select Microsoft
Select TCP/IP, and then click OK
Enabling Dhcp to Automatically Configure TCP/IP Settings
Choose Settings, and then Control Panel
Restart your PC for the changes to take effect
Primary Network Logon is set to Windows logon
Selecting Windows’ Internet Access Method
Verifying TCP/IP Properties
Click OK to continue Restart the PC
Configuring Windows NT4, 2000 or XP for IP Networking
Double-click the Network and Dialup Connections icon
Dhcp Configuration of TCP/IP in Windows XP
Then, restart your PC
Locate your Network Neighborhood icon
Reference Manual for the ProSafe VPN Firewall FVS114
Dhcp Configuration of TCP/IP in Windows
Reference Manual for the ProSafe VPN Firewall FVS114
Obtain an IP address automatically is selected
Dhcp Configuration of TCP/IP in Windows NT4
Reference Manual for the ProSafe VPN Firewall FVS114
Verifying TCP/IP Properties for Windows XP, 2000, and NT4
TCP/IP Properties dialog box now displays
Configuring the Macintosh for TCP/IP Networking
Default gateway is Type exit
MacOS 8.6 or
MacOS
Verifying TCP/IP Properties for Macintosh Computers
Are Login Protocols Used?
What Is Your Configuration Information?
Verifying the Readiness of Your Internet Account
Select the IP Address tab
Select the Gateway tab
Reference Manual for the ProSafe VPN Firewall FVS114
Restarting the Network
Reference Manual for the ProSafe VPN Firewall FVS114
List of Glossary Terms
Numeric
AES
Packet sent to all devices on a network
DNS
See Internet Control Message Protocol
Internet service provider
Megabits per second
Set of rules for communication between devices on a network
Radius
See Wide Area Network
Reference Manual for the ProSafe VPN Firewall FVS114
Reference Manual for the ProSafe VPN Firewall FVS114