■Broken—No cable attached.
Current Utilization—The percentage of bandwidth usage for the port you are currently viewing. This value indicates the general traffic level on the individ- ual port. Ideally, this figure should be below 60%, which indicates that the port is responsible for a rea- sonable amount of traffic relative to the entire ring.
High utilization values suggest that you should adjust the network topology by reducing load on that port through segmentation.
Frames Forwarded—A running average of the pro- portion of the received frames forwarded. This value is expressed as a percentage of all received frames, based on a sampling interval of 20 seconds.
Broadcast Frame Bandwidth—A running average of the broadcast frame bandwidth. This value is expressed as a percentage of theoretical maximum bandwidth availability, based on a sampling interval of 20 seconds.
Error Frames—This field displays a running average of the percentage of error frames with CRC errors and is based on a sampling interval of 20 seconds.
Traffic Statistics—Select this category to view the Port Statistics (Traffic) screen. See the next section.
Port Statistics (Traffic) | 6-3 |
Port Statistics (Traffic)
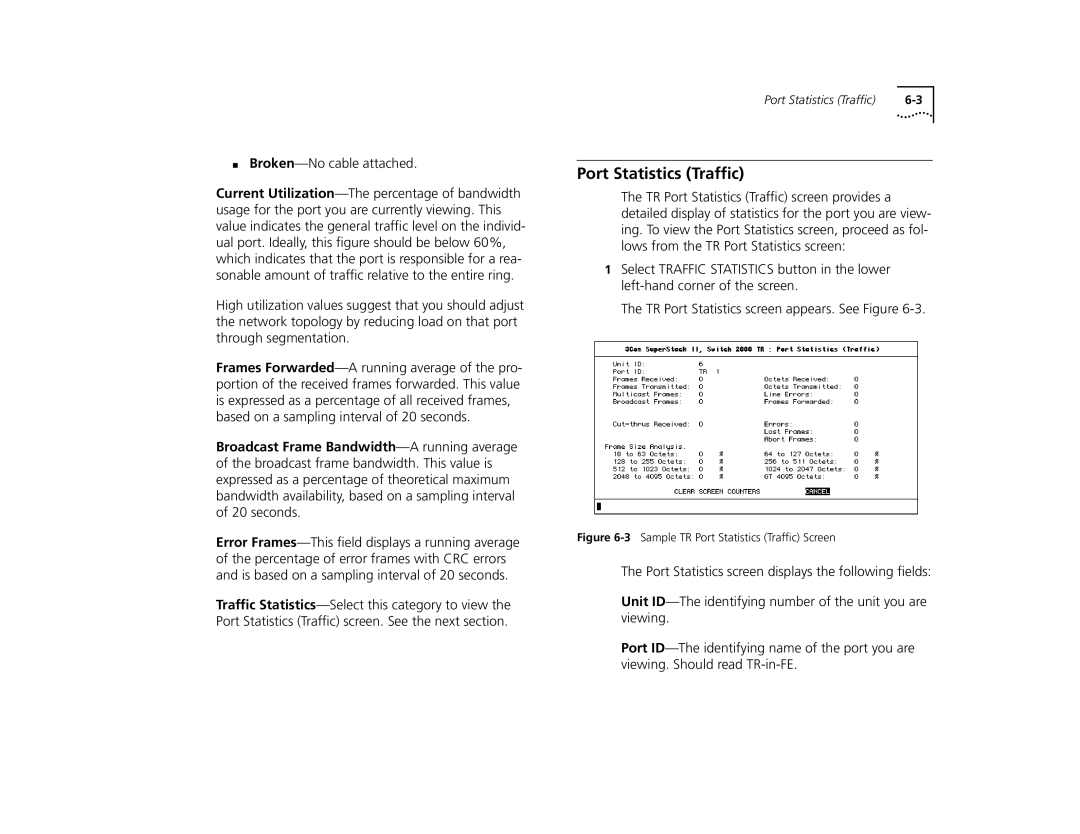
The TR Port Statistics (Traffic) screen provides a detailed display of statistics for the port you are view- ing. To view the Port Statistics screen, proceed as fol- lows from the TR Port Statistics screen:
1Select TRAFFIC STATISTICS button in the lower left-hand corner of the screen.
The TR Port Statistics screen appears. See Figure 6-3.
Figure 6-3Sample TR Port Statistics (Traffic) Screen
The Port Statistics screen displays the following fields:
Unit ID—The identifying number of the unit you are viewing.
Port ID—The identifying name of the port you are viewing. Should read TR-in-FE.

