Chapter 3: Installation
Data Collection Type
This refers to the data collection from the sensor and how the data is then displayed on the graphs.
There are three options for collection of data: Average, Highest, and Lowest. The default setting is “Average.”
When the data collection type is set to “Average,” the output graphs for the daily, monthy, and yearly all have the same size on the screen. For the daily graph, each data point on the graph is one data point collected from the sensor. But for the monthly and yearly graph, to display more data into the same size as for the daily graph, some consolidation on the data is needed. One data point on the monthly and yearly graph is the average of the sensor data in a range.
The maximum and minimum values showing on the monthly and yearly graphs are the value of this consolidated data and not the raw data over that period of time.
When the Data Collection Type is set to the highest setting,then you will get the graphing output dsiplaying the sensor‘s highest reading. This is the same for the lowest setting.
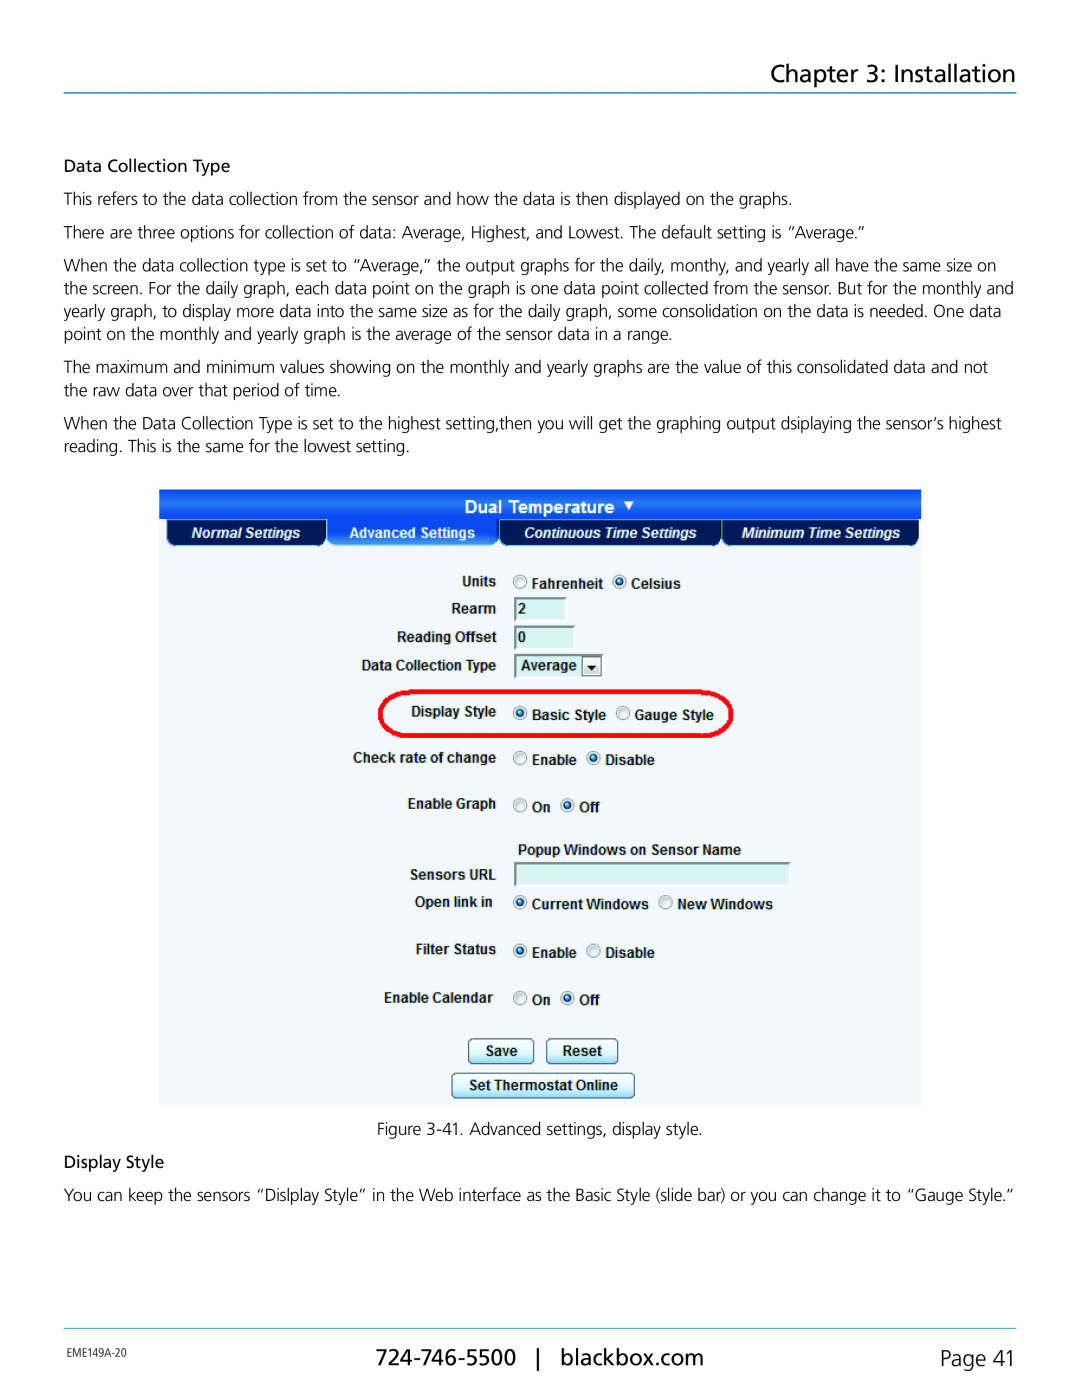
Figure
Display Style
You can keep the sensors “Dislplay Style” in the Web interface as the Basic Style (slide bar) or you can change it to “Gauge Style.”
Page 41 | ||
|
|