CLI Reference Guide
Aug
Contents
Using the CLI
Address Table Commands
Clock
Ethernet Configuration Commands
Igmp Snooping Commands
Lacp Commands
Management ACL
Port Monitor Commands
Rmon Commands
Spanning-Tree Commands
SSH Commands
Syslog Commands
Tacacs Commands
Vlan Commands
32 802.1x Commands
382
Page
Command Groups
Command Groups
Introduction
Configures Tacacs commands
Configures and reports on Spanning Tree protocol
Configures commands related to 802.1x security protocol
Address Table Commands
AAA Commands
Configures the system to automatically switch
Configures an external time source for
Defines an authentication key for Simple
Displays statically created entries in the bridge
Configuration and Image Files Commands
Displays the backup configuration file contents
Ethernet Configuration Commands
Gvrp Commands
Defines a default gateway router
Igmp Snooping Commands
IP Addressing
Sets an IP address
Deletes entries from the host name-to-address
Line Commands
Cache
Sets the line for automatic baud rate detection
Lldp Commands
PHY Diagnostics Commands
Management ACL Commands
Port Monitor Commands
Port Channel Commands
QoS Commands
Enables each port trust state
Radius Commands
Snmp Commands
Rmon Commands
Spanning Tree Commands
MST
Overrides the default link-type setting
SSH Commands
Sets the default path cost method
Syslog Commands
Tacacs Commands
System Management Commands
Reloads the operating system
Vlan Commands
User Interface Commands
Switches the mode to debug
Disables the default Vlan functionality
Interface
Reserves a Vlan as the internal usage Vlan of an
Web Server Commands
Command Description Access Mode
802.1x Commands
Command Groups
GC Global Configuration Mode
Command Modes
Device
Notification operation
Sntp
IC Interface Configuration Mode
Frame, from the client, before resending the request
An Extensible Authentication Protocol EAP request/identity
Reserves a Vlan as the internal usage Vlan of an interface
Enables the Simple Network Time Protocol Sntp client on an
LC Line Configuration Mode
Command Description
PE Privileged User Exec Mode
MA Management Access-level Mode
Vlan
UE User Exec Mode
SP SSH Public Key Mode
Command Modes
VC Vlan Configuration Mode
W . d e l l . c o m s u p p o r t . d e l l . c o m
CLI Command Modes
Using the CLI
Introduction
Privileged Exec Mode
User Exec Mode
Exit End Ctrl+Z
Global Configuration Mode
Starting the CLI
Entering Commands
Editing Features
Consoleconfig# username admin password smith
Negating the Effect of Commands
Terminal Command Buffer
Command Completion
Config#interface ethernet
Keyboard Shortcuts
CLI Command Conventions
Italic font
Enter
Using the CLI
Aaa authentication login
AAA Commands
Default Configuration
Command Mode
Following example configures authentication login
Aaa authentication enable
Example
Console config# aaa authentication enable default enable
Login authentication
Console config-line#login authentication default
Enable authentication
Console config-line#enable authentication default
Ip http authentication
Following example configures the http authentication
Show authentication methods
Ip https authentication
Following example configures https authentication
This command has no default configuration
Syntax Show authentication methods Default Configuration
Privileged Exec mode
Following example displays the authentication configuration
Console# show authentication methods
Password
Syntax Password password encrypted No password
No password is required
Enable password
Following example specifies a password secret on a line
Show users accounts
Username
No user is defined
Console# show users accounts
Syntax Show users accounts Default Configuration
AAA Commands
Interface configuration Vlan mode
Address Table Commands
Bridge address
This example, bridge multicast filtering is enabled
Disabled. All multicast addresses are flooded to all ports
Console config# bridge multicast filtering
Bridge multicast filtering
Examples
No multicast addresses are defined
Following example registers the MAC address
Bridge multicast forbidden address
Command Modes
No forbidden addresses are defined
Bridge multicast forward-all
Disable forward-all on the specified interface
Bridge multicast forbidden forward-all
This example all multicast packets on port g8 are forwarded
Syntax
Bridge aging-time
Syntax Clear bridge
Clear bridge
Console# clear bridge
Interface Configuration Ethernet, port-channel mode
Disabled No port security
Port security
Port security routed secure-address
Console config-if#port security routed secure-address
Show bridge address-table
Mac-address-Specify a MAC address in the format
Port-channel-number-A valid port-channel number
Console# show bridge address-table
Show bridge address-table static
Console# show bridge address-table static
Show bridge address-table count
Syntax Show bridge address-table count vlan vlan
Vlan -Specific Vlan
Console# show bridge address-table count
Show bridge multicast address-table
Console # show bridge multicast address-table format ip
Console # show bridge multicast address-table
Show ports security
Show bridge multicast filtering
Syntax Show bridge multicast filtering vlan-id
Vlanid-A valid Vlan ID value
Console # show ports security
Clock set
Clock
Clock source
Syntax Clock source sntp No clock source
No external clock source
Clock timezone
Console# clock source sntp
Clock summer-time
No authentication key is defined
Sntp authentication-key
Consoleconfig# sntp authentication-key 8 md5 ClkKey
Sntp authenticate
Syntax Sntp authenticate No sntp authenticate
Following example authenticates key
Sntp client poll timer
Sntp trusted-key
Not trusted
Console config# sntp client poll timer
Sntp broadcast client enable
Console config# sntp broadcast client enable
Sntp client enable interface
Sntp anycast client enable
Console config-if#sntp anycast client enable
Syntax Sntp client enable No sntp client enable
Console config# sntp unicast client enable
Sntp unicast client enable
101
Sntp unicast client poll
Console config# sntp unicast client poll
Sntp server
Syntax Sntp unicast client poll no sntp unicast client poll
Syntax Show clock detail
Show clock
103
104
Console# show clock
Syntax Show sntp configuration
Show sntp configuration
Console# show sntp configuration
105
Syntax Show sntp status
Show sntp status
Following example shows the status of the Sntp
106
107
Clock
Delete startup-config
Configuration and Image Files
Console# delete startup-config
Copy
110
Understanding Invalid Combinations of Source and Destination
Copy Character Descriptions
Storing the Running or Startup Configuration on a Server
Copying image file from a Server to Flash Memory
111
Syntax Boot system image-1 image-2
Boot system
Console# boot system image-1
112
Syntax Show running-config sort type
Show running-config
Sort type defaults to interface if unspecified
113
Console# show running-config no spanning-tree
Show startup-config
Syntax Show startup-config sort type 114
115
Console# show startup-config no spanning-tree
Show backup-config
Syntax Show backup-config 116
117
Console# show backup-config software version
Syntax Show bootvar Default Configuration
Show bootvar
Console# show bootvar
118
Interface ethernet
Ethernet Configuration Commands
Interface range ethernet
Interface is enabled
Syntax Shutdown No shutdown Default Configuration
Following example disables port g5
Shutdown
Speed
Description
Syntax Description string No description
Syntax Speed 100 1000 No speed
Syntax Duplex half full No duplex
Duplex
122
Syntax Negotiation No negotiation Default Configuration
Consoleconfig# interface ethernet g5
Negotiation
Flowcontrol
Syntax Flowcontrol auto on off No flowcontrol
Mdix
Syntax Mdix on auto No mdix
124
Back-pressure
Syntax Back-pressure No back-pressure Default Configuration
125
Clear counters
Port jumbo-frame
126
Set interface active
Show interfaces configuration
Console# clear counters ethernet g1
Console# set interface active ethernet g5
128
Interfaces configuration
129
Show interfaces status
Console# show interfaces status
130
131
Show interfaces description
Console# show interfaces description ethernet g1
Show interfaces counters
132
Console# show interfaces counters
133
Console# show interfaces counters ethernet g1
Following example displays counters for port g1
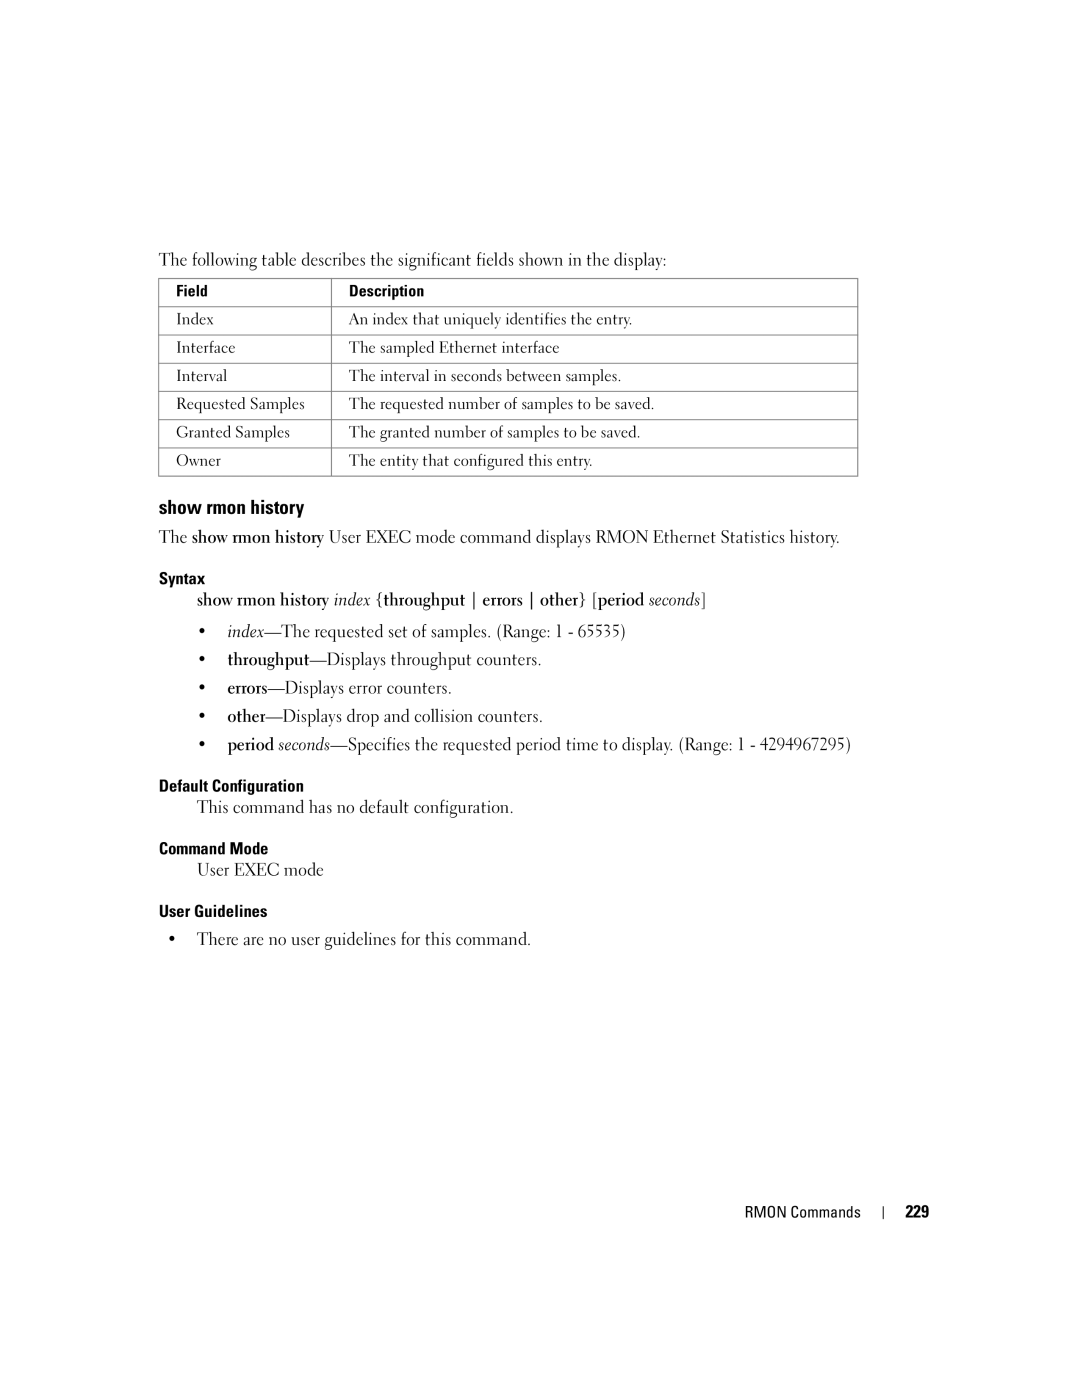
Following table describes the fields shown in the display
134
Ieee Std .3, 2000 Edition, section
135
Show ports jumbo-frame
Syntax Show ports jumbo-frame Default Configuration
136
Consoleconfig# port storm-control include-multicast
Port storm-control broadcast enable
Port storm-control include-multicast
Console# show ports jumbo-frame
Consoleconfig-if#port storm-control broadcast enable
Broadcast storm control is disabled
Default storm control broadcast rate is
Port storm-control broadcast rate
Following example displays the storm control configuration
Consoleconfig-if#port storm-control broadcast rate
Show ports storm-control
Syntax Show ports storm-control interface
140
Gvrp enable global
Gvrp Commands
Gvrp enable interface
Syntax Gvrp enable No gvrp enable Default Configuration
Following example enables Gvrp on ethernet g8
Garp timer
142
Gvrp vlan-creation-forbid
By default, dynamic Vlan creation is enabled
143
Console config-if#gvrp registration-forbid
Console config-if#gvrp vlan-creation-forbid
Gvrp registration-forbid
Clear gvrp statistics
Console# clear gvrp statistics ethernet g8
Show gvrp configuration
145
Show gvrp statistics
Console# show gvrp configuration
146
Following example shows Gvrp statistics information
Show gvrp error-statistics
147
Console# show gvrp statistics
Following example displays Gvrp statistics information
Console# show gvrp-error statistics
148
Ip igmp snooping Global
Igmp Snooping Commands
Ip igmp snooping Interface
149
Ip igmp snooping host-time-out
Ip igmp snooping mrouter
150
Ip igmp snooping mrouter-time-out
Console config-if#ip igmp snooping host-time-out
151
Default leave-time-out configuration is 10 seconds
Console config-if#ip igmp snooping mrouter-time-out
Console config-if#ip igmp snooping leave-time-out
Ip igmp snooping leave-time-out
Show ip igmp snooping interface
Show ip igmp snooping mrouter
Console # show ip igmp snooping mrouter
Example displays Igmp snooping information
Show ip igmp snooping groups
Console # show ip igmp snooping interface
154
Console # show ip igmp snooping groups
Example shows Igmp snooping information
155
Igmp Snooping Commands
Clear host dhcp
IP Addressing Commands
Ip address
Console# clear host dhcp
Ip address dhcp
Interface configuration Ethernet, VLAN, port-channel
No IP address is defined for interfaces
158
Syntax Ip default-gateway ip-address No ip default-gateway
Ip default-gateway
No default gateway is defined
159
Show ip interface
Following example defines an ip default gateway
160
Console# show ip interface
Arp
161
Console config# arp 198.133.219.232 00000c400fbc ethernet
Arp timeout
Clear arp-cache
Show arp
Syntax Show arp Default Configuration
Console# clear arp-cache
Following example displays entries in the ARP table
Ip domain-name
Ip domain-lookup
Syntax Ip domain-lookup No ip domain-lookup
Syntax Ip domain-name name No ip domain-name
Ip host
Ip name-server
No name server addresses are specified
Following example sets the available name server
Syntax Ip host name address No ip host name
Clear host
No host is defined
Syntax Clear host name
Show hosts
Default Configuration Command Mode
Syntax Show hosts name
167
168
Lacp system-priority
Lacp Commands
Lacp port-priority
Syntax Lacp port-priority value No lacp port-priority
Syntax Lacp timeout long short No lacp timeout
Lacp timeout
Default port timeout value is long
170
Show lacp port-channel
Show lacp ethernet
Console# show lacp ethernet g1 statistics
Syntax Show lacp port-channel portchannelnumber
172
Console# show lacp port-channel
Line
Line Commands
Syntax Line console telnet ssh
Syntax Speed bps
Syntax Autobaud No autobaud Default Configuration
Exec-timeout
Autobaud
174
Show line
Syntax Exec-timeout minutes seconds No exec-timeout
Syntax Show line console telnet ssh
175
Terminal history
Following example displays the line configuration
Terminal history size
Console# show line console
177
Maximum for the sum of all buffers is
Line Commands
Lldp enable global
Lldp Commands
Lldp enable interface
Syntax
Interface configuration Ethernet
Lldp timer
Syntax Lldp timer seconds No lldp timer
Default 30 seconds
Default Configuraiton
Lldp reinit-delay
Lldp hold-multiplier
Syntax Lldp hold-multiplier number No lldp hold-multiplier
Syntax Lldp reinit-delay seconds No lldp reinit-delay
Lldp tx-delay
Syntax Lldp tx-delay seconds No lldp tx-delay Parameters
Default value is 2 seconds
Lldp management-address
Lldp optional-tlv
Usage Guidelines
No optional TLV is transmitted
184
Clear lldp rx
Syntax Show lldp configuration ethernet interface
Show lldp configuration
Switch# show lldp configuration
Show lldp local
186
Show lldp neighbors
Switch# show lldp neighbors ethernet g1
Switch# show lldp neighbors
187
Lldp Commands
Name-The access list name using up to 32 characters
Management access-list
Management ACL
189
Permit management
Console config# management access-class mlist
190
Deny management
Management Access-list Configuration mode
191
192
Management access-class
Show management access-class
Show management access-list
Syntax Show management access-list name
Console# show management access-list
Console# show management access-class
Syntax Show management access-class Default Configuration
194
Test copper-port tdr
PHY Diagnostics Commands
Show copper-ports tdr
Console# test copper-port tdr g3
Syntax Show copper-ports cable-length interface
Show copper-ports cable-length
Port must be active and working in 1000M
196
Console# show copper-ports cable-length
Show fiber-ports optical-transceiver
197
Console# show fiber-ports optical-transceiver
198
Console# show fiber-ports optical-transceiver detailed
199
PHY Diagnostics Commands
Console config# interface port-channel
Port Channel Commands
Interface port-channel
Interface range port-channel
Channel-group
Console config# interface range port-channel
Port is not assigned to any port-channel
202
Port channel load balance
Console config-if#channel-group 1 mode on
Show interfaces port-channel
Syntax Show interfaces port-channel port-channel-number
204
Default is both rx and tx
Port Monitor Commands
Interface Configuration mode
Port monitor
Show ports monitor
Syntax Show ports monitor Default Configuration
206
207
Console# show ports monitor
Port Monitor Commands
Qos
QoS Commands
Show qos
Wrr-queue cos-map
Following example displays a QoS mode
210
Wrr-queue bandwidth
Interface Configuration Ethernet, port channel mode
Following example maps CoS 3 to queue
211
Priority-queue out num-of-queues
Following example assigns WRR weights to egress queues
All queues are expedite queues
212
Show qos interface
Console config# priority-queue out num-of-queues
Following example sets queue 4, 3 to be expedite queues
213
Console# show qos interface ethernet g1 queuing
Qos map dscp-queue
214
Syntax Qos trust cos dscp No qos trust
Qos trust Global
215
Syntax Qos cos default-cos No qos cos 216
Syntax Qos trust No qos trust Default Configuration
Qos trust Interface
Qos cos
Syntax Show qos map dscp-queue
Show qos map
217
Console# show qos map Dscp-queue map
Following example displays the Dscp port-queue map
Following table describes the fields used above
D1 x 10 + D2 = Value of Dscp
By default, no Radius host is specified
Radius Commands
Radius-server host
Ip-address-IP address of the Radius server host
Default is an empty string
Timeout
Radius-server key
Syntax Radius-server key key-string No radius-server key
Radius-server retransmit
Console config# radius-server retransmit
Radius-server source-ip
221
Console config# radius-server timeout
Radius-server timeout
222
Syntax Show radius-servers Default Configuration
Console config# radius-server deadtime
Radius-server deadtime
Show radius-servers
224
Following example displays the Radius server settings
Console# show radius-servers
Show rmon statistics
Rmon Commands
Console# show rmon statistics ethernet g1
225
Field Description
226
227
Rmon collection history
Show rmon collection history
Console config-if#rmon collection history 1 interval
Following example displays all Rmon group statistics
Console# show rmon collection history
229
Show rmon history
230
Console# show rmon history 5 errors
Console# show rmon history 5 throughput
231
Console# show rmon history 5 other
232
Rmon alarm
233
Show rmon alarm-table
Syntax Show rmon alarm-table Default Configuration
Show rmon alarm
Console# show rmon alarm-table
Syntax Show rmon alarm number
Console# show rmon alarm
Following example displays Rmon 1 alarms
235
236
Rmon event
Syntax Show rmon events Default Configuration
Following example configures an event with the trap index
Show rmon events
Following example displays the Rmon event table
Console# show rmon events
Show rmon log
Syntax Show rmon log event
Event-Event index. Range 0
Console# show rmon log
Following example displays the Rmon logging table
239
Rmon table-size
Console config# rmon table-size history
History table size is Log table size is
240
There are no default communities defined
Snmp Commands
Snmp-server community
No snmp-server community community ip-address
Default and DefaultSuper views exists
Default Setting
Snmp-server view
242
Product specific
Snmp-server filter
243
Snmp-server location
Snmp-server contact
Included
Syntax Snmp-server contact text No snmp-server contact
Console config# snmp-server enable traps
Snmp-server enable traps
Syntax Snmp-server location text No snmp-server location
245
Console config# snmp-server trap authentication
Snmp-server trap authentication
Snmp-server host
246
247
Snmp-server set
248
Snmp-server group
Snmp-server user
Console config# snmp-server group user-groupv3 priv read
No group entry exists
Router context is translated to context in the MIB
250
Console config# snmp-server user
Following example configures a new Snmp Version 3 user
Snmp-server v3-host
251
Snmp-server engineID local
Following example configures an SNMPv3 host
252
Consoleconfig # snmp-server engineID local default
Syntax Show snmp engineID Default Setting
Show snmp engineid
253
Show snmp
Syntax Show snmp Default Configuration
Console# sh snmp
254
Syntax Show snmp views viewname
Show snmp views
255
Syntax Show snmp groups groupname
Show snmp groups
256
Syntax Show snmp filters filtername
Show snmp filters
257
Syntax Show snmp users username
Show snmp users
258
259
Snmp Commands
Spanning-tree mode
Spanning-Tree Commands
Syntax Spanning-tree No spanning-tree Default Configuration
Spanning-tree
Consoleconfig# spanning-tree forward-time
Consoleconfig# spanning-tree mode rstp
Spanning-tree forward-time
Seconds-Time in seconds. Range 4
263
Spanning-tree hello-time
Spanning-tree max-age
Consoleconfig# spanning-tree hello-time
264
Consoleconfig# spanning-tree max-age
Spanning-tree disable
Consoleconfig# spanning-tree priority
Spanning-tree priority
Spanning-tree cost
Following example disables spanning-tree on g5
Syntax Spanning-tree cost cost No spanning-tree cost
Cost-The port path cost Range 1 200,000,000
Spanning-tree port-priority
Consoleconfig-if#spanning-tree port-priority
Spanning-tree portfast
267
Consoleconfig-if#spanning-tree link-type shared
Consoleconfig-if#spanning-tree portfast
Spanning-tree link-type
268
Console config # spanning-tree mst 1 priority
Default number of hops is
Spanning-tree mst priority
Spanning-tree mst max-hops
Consoleconfig-if#spanning-tree mst 1 port-priority
Console config # spanning-tree mst max-hops
Spanning-tree mst port-priority
270
Spanning-tree mst cost
Spanning-tree mst configuration
Interface Long Short
271
Instance mst
Syntax Spanning-tree mst configuration Default Setting
Syntax Instance instance-id add remove vlan vlan-range
272
Revision mst
Name mst
Syntax Name string
Syntax Revision value No revision
Following example sets the configuration revision to
Default configuration revision number is
Show mst
Syntax Show current pending
Syntax Abort Default Setting
Syntax Exit Default Setting
Exit mst
Abort mst
Spanning-tree bpdu
Spanning-tree pathcost method
Console# spanning-tree pathcost method long
276
Clear spanning-tree detected-protocols
Consoleconfig# spanning-tree bpdu flooding
Syntax Spanning-tree bpdu filtering flooding
277
Console# clear spanning-tree detected-protocols ethernet g1
Show spanning-tree
Following example displays spanning-tree information
278
Console# show spanning-tree
279
280
281
282
283
284
285
286
Console# show spanning-tree mst-configuration
287
288
289
290
Spanning-tree mst mstp-rstp
Root guard is disabled
Consoleconfig# spanning-tree mst mstp-rstp
Interface configuration Ethernet, port-channel
Spanning-tree guard root
Consoleconfig-if#spanning-tree guard root
Following example enable root guard on port g8
292
Ip ssh port
SSH Commands
Ip ssh server
Console config# crypto key generate dsa
Syntax Crypto key generate dsa Default Configuration
Crypto key generate dsa
Crypto key generate rsa
Console config# crypto key generate rsa
Syntax Crypto key generate rsa Default Configuration
Ip ssh pubkey-auth
295
Crypto key pubkey-chain ssh
Consoleconfig# crypto key pubkey-chain ssh
User-key
Syntax Key-string row key-string
Key-string
297
Show ip ssh
Syntax Show ip ssh Default Configuration
298
Show crypto key mypubkey
Following example displays the SSH server configuration
Syntax Show crypto key mypubkey rsa dsa
Rsa-RSA key Dsa-DSA key
300
Show crypto key pubkey-chain ssh
Console# show crypto key mypubkey rsa
Following example displays the SSH public called bob
Console# show crypto key pubkey-chain ssh
Console# show crypto key pubkey-chain ssh username bob
301
SSH Commands
Syntax Logging on no logging on Default Configuration
Syslog Commands
Logging on
Logging
Logging console
Default is informational
As described in the field descriptions
Syntax Logging console level No logging console
Logging buffered
Default level is informational
Logging buffered size
Syntax Logging buffered level No logging buffered
Syntax Clear logging Default Configuration
Console config# logging buffered size
Clear logging
Console# clear logging
Logging file
Syntax Clear logging file Default Configuration
Clear logging file
Syntax Logging file level No logging file
Show logging
Syntax Show logging Default Configuration
Following example clears messages from the logging file
Console# clear logging file
Show logging file
Syntax Show logging file Default Configuration
Console# show logging
309
Show syslog-servers
Syntax Show syslog-servers Default Configuration
310
Console# show syslog-servers
Following example displays the syslog server settings
311
Syslog Commands
System Management
Timeout timeout-The default is 2000 milliseconds
Ping
313
Following example displays a ping to IP address
Traceroute
314
315
316
Telnet
Special Telnet Command characters
317
318
Keywords Table
319
Ports Table
Resume
Following command switches to another open Telnet session
Syntax Resume connection
320
Hostname
Reload
Show sessions
Show users
Console# show users
Show system
Exec mode
Console show sessions
Syntax Show system
Following example displays the system information
Show version
Syntax Show version 324
Console show system
Syntax Asset-tag tag No asset-tag
Asset-tag
Tag-The device asset tag. Range 1- 16 characters
325
Show system id
Syntax Show system id Default Configuration
Console show system id
326
Tacacs-server host
Tacacs Commands
No Tacacs host is specified
327
Following example sets the authentication encryption key
Tacacs-server timeout
Tacacs-server key
Following example specifies a TACACS+ host
Tacacs-server source-ip
Console config# tacacs-server timeout
329
Syntax Show tacacs ip-address
Show tacacs
Ip-address-Name or IP address of the host
Console# show tacacs
Disable
Enable
User Interface
Configure
Login
Syntax Login Default Configuration
Syntax Configure
Syntax Exit Default Configuration
Exitconfiguration
All command modes
333
ExitEXEC
Syntax End Default Configuration
End
Following example closes an active terminal session
Syntax History No history Default Configuration
Syntax Help Default Configuration
Help
History
Syntax Debug-mode Default Configuration
Syntax History size number-of-commands No history size
History size
Debug-mode
Show history
Syntax Show history Default Configuration
337
Show privilege
Syntax Show privilege Default Configuration
Console# show history
Console# show privilege
Vlan database
Vlan Commands
Vlan
Interface vlan
Default-vlan disable
Console# vlan database
Syntax Interface range vlan vlan-range all
Interface range vlan
341
Name
Switchport access vlan
Syntax Name string no name
342
Console config-if#switchport access vlan
Switchport trunk allowed vlan
343
Switchport general allowed vlan
Switchport trunk native vlan
Console config-if#switchport trunk allowed vlan add 2,5-8
Console config-if#switchport trunk native vlan
345
Switchport general pvid
Ingress filtering is enabled
Switchport general ingress-filtering disable
346
Switchport forbidden vlan
Switchport general acceptable-frame-type tagged-only
All frame types are accepted at ingress
All VLANs allowed
Map protocol protocols-group
Console config-if#switchport forbidden vlan add
Following example maps protocol ip-arp to the group named
348
Ip internal-usage-vlan
Switchport general map protocols-group vlan
Vlan-id-VLAN ID of the internal usage VLAN.Range Valid Vlan
349
Show vlan
Console config# ip internal-usage-vlan
Syntax Show vlan tag vlan-id name vlan-name
Following example displays all Vlan information
Show vlan internal usage
Syntax Show vlan internal usage Default Configuration
351
Show vlan protocols-groups
Syntax Show vlan protocols-groups Default Configuration
Console# show vlan internal usage
Following example displays protocols-groups information
Console# show vlan protocols-groups
Show interfaces switchport
353
Console# show interface switchport ethernet g1
Switchport mode
Syntax Switchport mode customer access trunk general 354
No switchport mode
Switchport customer vlan
No Vlan is configured
Vlan-id- Vlan ID of the customer
356
Ip http server
Web Server
Ip http port
Syntax Ip http port port-number No ip http port
Ip https server
Default for the device is disabled
Ip https port
Syntax Ip https port port-number No ip https port
Crypto certificate generate
Following example configures the https port number to
359
Crypto certificate request
Console enable# crypto certificate generate key-generate
Certificate and the SSL RSA key pairs do not exist
Following example regenerates a Https certificate
361
Console# crypto certificate 1 request
Syntax Crypto certificate number import
Crypto certificate import
Number-Specifies the certificate number. Range 1
362
Ip https certificate
Consoleconfig# crypto certificate 1 import
Certificate number
363
Crypto certificate export pkcs12
Console config# ip https certificate
Syntax Crypto certificate number export pkcs12
364
365
Following example exports the certificate and RSA keys
Console# crypto certificate 1 export pkcs12
Syntax Crypto certificate number import pkcs12 passphrase
Crypto certificate import pkcs12
Following example imports the certificate and RSA keys
366
367
Syntax Show crypto certificate mycertificate number
Show crypto certificate mycertificate
Following example displays the certificate
Console# show crypto certificate mycertificate
Show ip https
Show ip http
Console# show ip http
370
Console# show ip https
Aaa authentication dot1x
802.1x Commands
Console config# aaa authentication dot1x default none
Method1 method2...-At least one from the following table
Console config# dot1x system-auto-control
Following example enables 802.1x globally
Dot1x system-auto-control
Dot1x port-control
Console config-if#dot1x port-control auto
Dot1x re-authentication
Syntax Dot1x re-authentication No dot1x re-authentication
373
Dot1x re-authenticate
Dot1x timeout re-authperiod
Console config-if#dot1x re-authentication
Console config-if#dot1x timeout re-authperiod
Console# dot1x re-authenticate ethernet g8
Dot1x timeout quiet-period
375
Console config-if#dot1x timeout quiet-period
Dot1x timeout tx-period
376
Dot1x max-req
Dot1x timeout supp-timeout
Syntax Dot1x max-req count No dot1x max-req
377
378
Dot1x timeout server-timeout
Show dot1x
Console config# dot1x timeout server-timeout
Syntax Show dot1x ethernet interface
379
Console# show dot1x ethernet g3
380
Syntax Show dot1x users username username
Show dot1x users
Username-Supplicant username Range 1- 160 characters
Following example displays 802.1X users
Syntax Show dot1x statistics ethernet interface
Show dot1x statistics
382
383
Switch# show dot1x statistics ethernet g1
Dot1x auth-not-req
User should be authorized to access the Vlan
Syntax Dot1x auth-not-req no dot1x auth-not-req
384
Dot1x single-host-violation
Dot1x multiple-hosts
Syntax Dot1x multiple-hosts no dot1x multiple-hosts
385
Forward trap
Show dot1x advanced
Syntax Show dot1x advanced ethernet interface
386
Switch# show dot1x advanced ethernet g1
Switch# show dot1x advanced
387
388
Console# show dot1x advanced ethernet g1