| MONITORING |
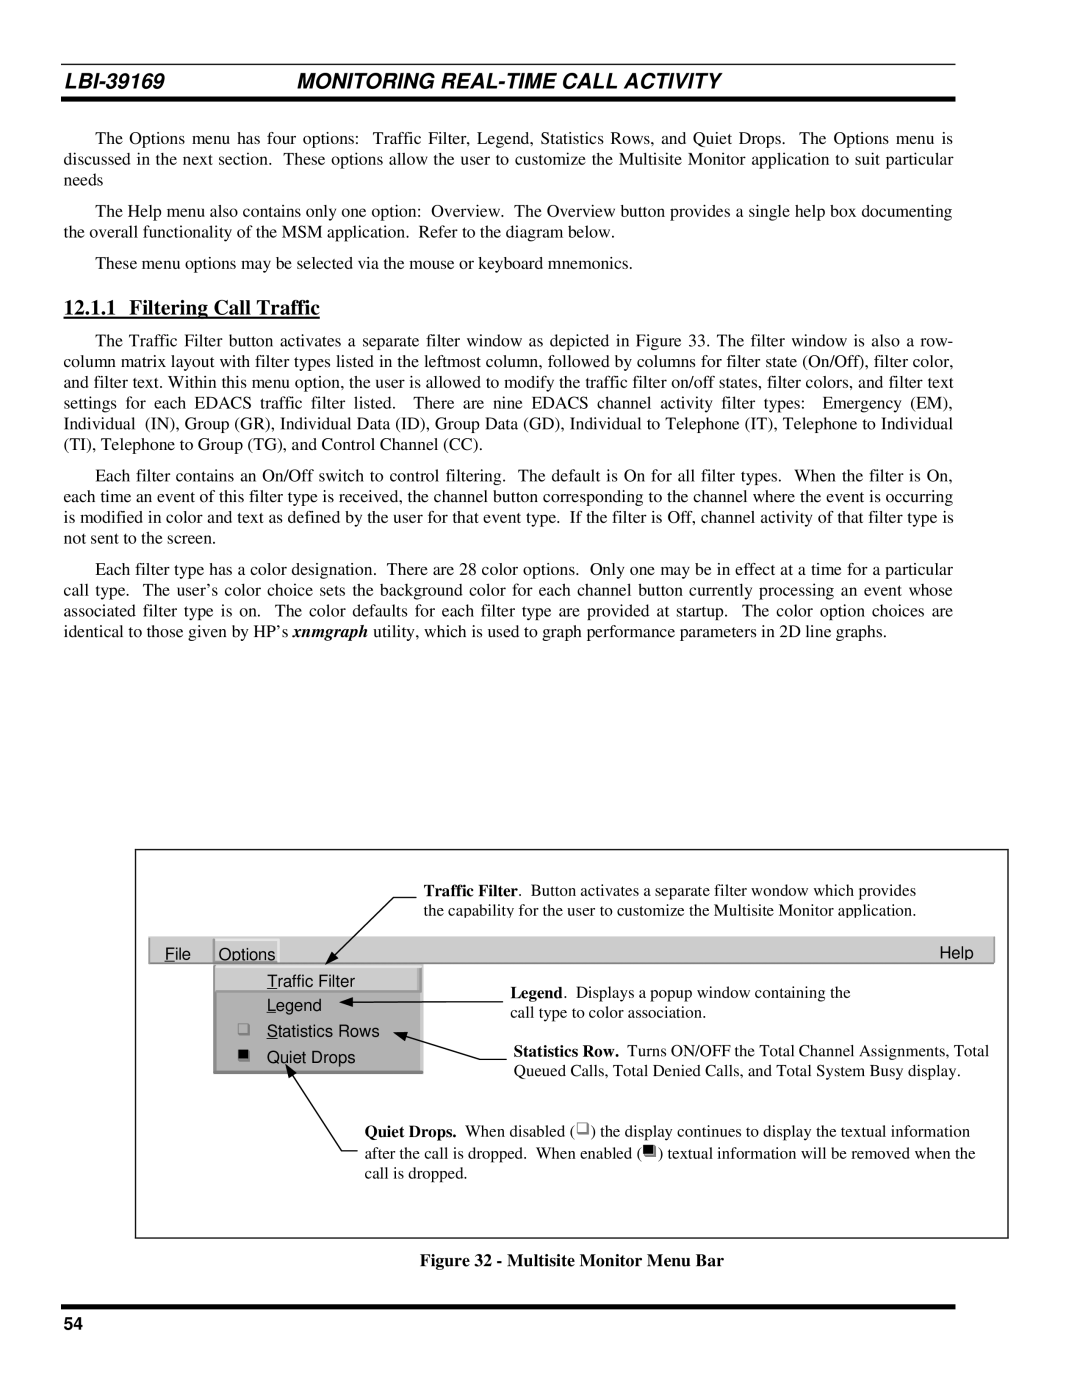
The Options menu has four options: Traffic Filter, Legend, Statistics Rows, and Quiet Drops. The Options menu is discussed in the next section. These options allow the user to customize the Multisite Monitor application to suit particular needs
The Help menu also contains only one option: Overview. The Overview button provides a single help box documenting the overall functionality of the MSM application. Refer to the diagram below.
These menu options may be selected via the mouse or keyboard mnemonics.
12.1.1 Filtering Call Traffic
The Traffic Filter button activates a separate filter window as depicted in Figure 33. The filter window is also a row- column matrix layout with filter types listed in the leftmost column, followed by columns for filter state (On/Off), filter color, and filter text. Within this menu option, the user is allowed to modify the traffic filter on/off states, filter colors, and filter text settings for each EDACS traffic filter listed. There are nine EDACS channel activity filter types: Emergency (EM), Individual (IN), Group (GR), Individual Data (ID), Group Data (GD), Individual to Telephone (IT), Telephone to Individual (TI), Telephone to Group (TG), and Control Channel (CC).
Each filter contains an On/Off switch to control filtering. The default is On for all filter types. When the filter is On, each time an event of this filter type is received, the channel button corresponding to the channel where the event is occurring is modified in color and text as defined by the user for that event type. If the filter is Off, channel activity of that filter type is not sent to the screen.
Each filter type has a color designation. There are 28 color options. Only one may be in effect at a time for a particular call type. The user’s color choice sets the background color for each channel button currently processing an event whose associated filter type is on. The color defaults for each filter type are provided at startup. The color option choices are identical to those given by HP’s xnmgraph utility, which is used to graph performance parameters in 2D line graphs.
|
|
|
|
|
|
| Traffic Filter. Button activates a separate filter wondow which provides | |
|
|
|
|
|
|
| the capability for the user to customize the Multisite Monitor application. | |
|
|
|
|
|
|
|
|
|
| File | Options |
|
|
| Help | ||
|
|
|
| Traffic Filter |
| Legend. Displays a popup window containing the | ||
|
|
|
| Legend |
| |||
|
|
|
|
| call type to color association. | |||
|
| GStatistics Rows | ||||||
|
|
|
| |||||
|
|
|
| Quiet Drops |
| Statistics Row. Turns ON/OFF the Total Channel Assignments, Total | ||
|
|
|
|
| ||||
|
|
|
|
| Queued Calls, Total Denied Calls, and Total System Busy display. | |||
|
|
|
|
|
|
| ||
|
|
|
|
|
| Quiet Drops. When disabled (G) the display continues to display the textual information | ||
|
|
|
|
|
| after the call is dropped. When enabled (G) textual information will be removed when the | ||
|
|
|
|
|
| call is dropped. | ||
Figure 32 - Multisite Monitor Menu Bar
54
