| USING OPENVIEW NETWORK NODE MANAGER |
13.5 THRESHOLD TRAPS ON COLLECTED DATA
The user may specify the generation of an event based upon the value of a monitored performance parameter or that parameter’s exceeding a
When a collected MIB value exceeds a threshold value, a trap is generated. A rearm mechanism exists to avoid continuously generating events. This feature is a subset of the Collecting MIB Data feature. See OpenView NNM User’s Guide sections titled Collecting MIB Data and Defining Thresholds.
13.6 VIEWING HISTORICAL TRENDS
Collected MIB data may be graphed later. The graph tool provided with OpenView Network Node Manager also allows the user to manipulate the data. See the OpenView NNM User’s Guide section titled Viewing Historical Trends.
13.7 EVENT HISTORY
The OpenView Network Node Manager Event Browser can generate a report listing the past and present events. The Event Browser updates in real time, i.e., incoming alarms associated with that object or its children are immediately updated to the display. The report consists of entries describing the event source, time of occurrence, severity level, and type. The user may filter the event history report based upon the source, severity level, a specified time range, and/or event type. Any generated report can be saved to a
13.8 CUSTOMIZING EVENT MESSAGES AND ACTIONS
The event log message may be modified. In addition, the user may add his own specific text to the event comment field. The criticality level and category of the event may also be changed. In addition to affecting icon color, actions may be associated with events, such as paging, audible notifications, or other executables. See the OpenView NNM User’s Guide section titled Defining Actions for Events. NOTE: Updates of the EDACS application will overwrite the event description (connect) field.
In the following example a burst of short beeps is associated with an SNMP event:
1.From the OpenView menu bar, select the Options- >Event Configuration:SNMP menu item.
2.Select the enterprise that the sources the event. For example, System Manager, IMC Manager, PI, etc.
3.Select the event of interest.
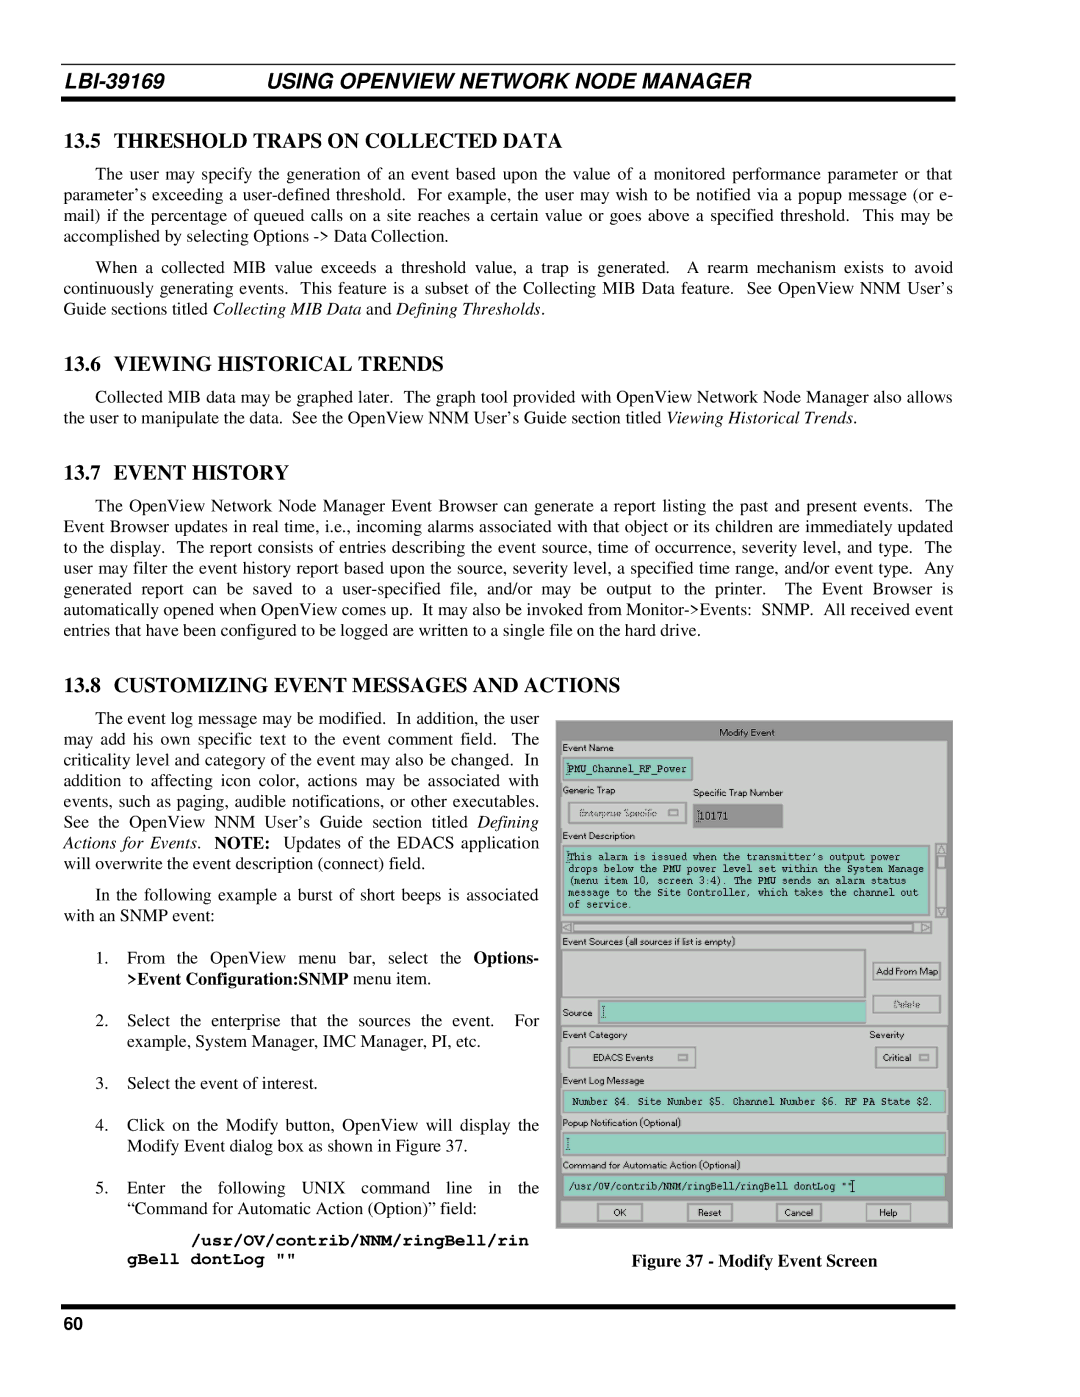
4.Click on the Modify button, OpenView will display the Modify Event dialog box as shown in Figure 37.
5.Enter the following UNIX command line in the “Command for Automatic Action (Option)” field:
/usr/OV/contrib/NNM/ringBell/rin |
|
gBell dontLog "" | Figure 37 - Modify Event Screen |
60