Performance Charts
Performance Charts
Pressure in psi (MPa, bar)
2000
(13.8, 138)
1500
(10.3, 103)
1000
(6.9, 69)
500
(3.4, 34)
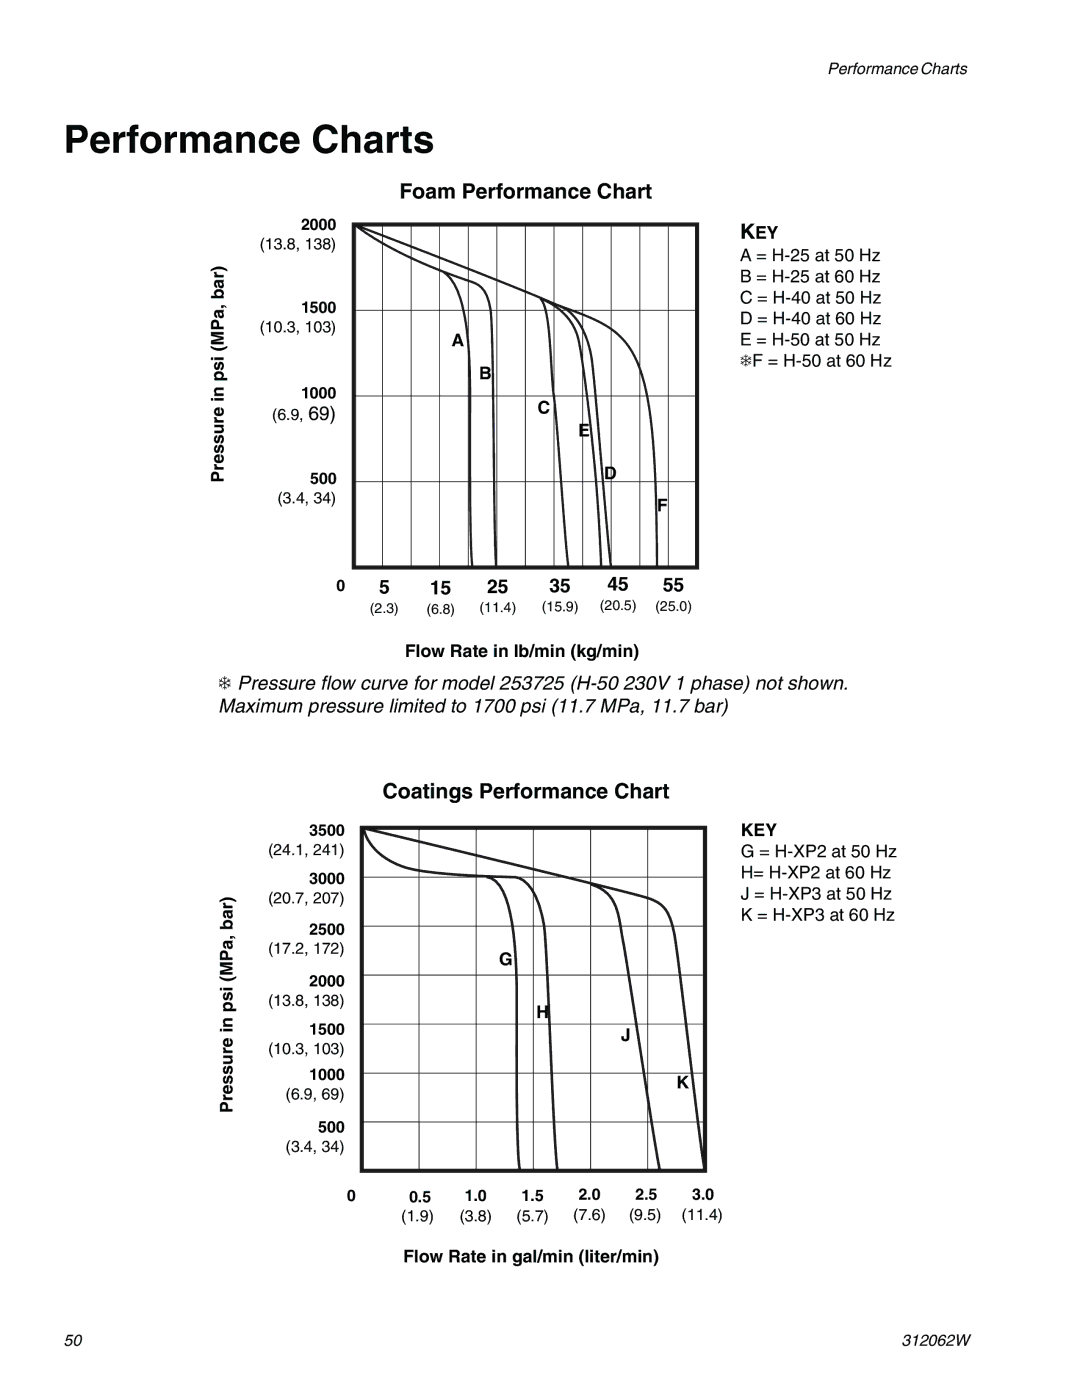
Foam Performance Chart
A
B
C
E
D
F
KEY
A =
C=
D=
E=
0 | 5 | 15 | 25 | 35 | 45 | 55 |
| (2.3) | (6.8) | (11.4) | (15.9) | (20.5) | (25.0) |
Flow Rate in lb/min (kg/min)
❄Pressure flow curve for model 253725
Pressure in psi (MPa, bar)
3500
(24.1, 241)
3000
(20.7, 207)
2500
(17.2, 172)
2000
(13.8, 138)
1500
(10.3, 103)
1000
(6.9, 69)
500
(3.4, 34)
Coatings Performance Chart
G
H
J
K
KEY
G =
J=
K=
0
0.5 | 1.0 | 1.5 | 2.0 | 2.5 | 3.0 |
(1.9) | (3.8) | (5.7) | (7.6) | (9.5) | (11.4) |
Flow Rate in gal/min (liter/min)
50 | 312062W |
