If you would like to see other values, changing them is easy. To change a value or a meter, click on the title of the value or meter and the following window will be displayed.
Select a new value from the
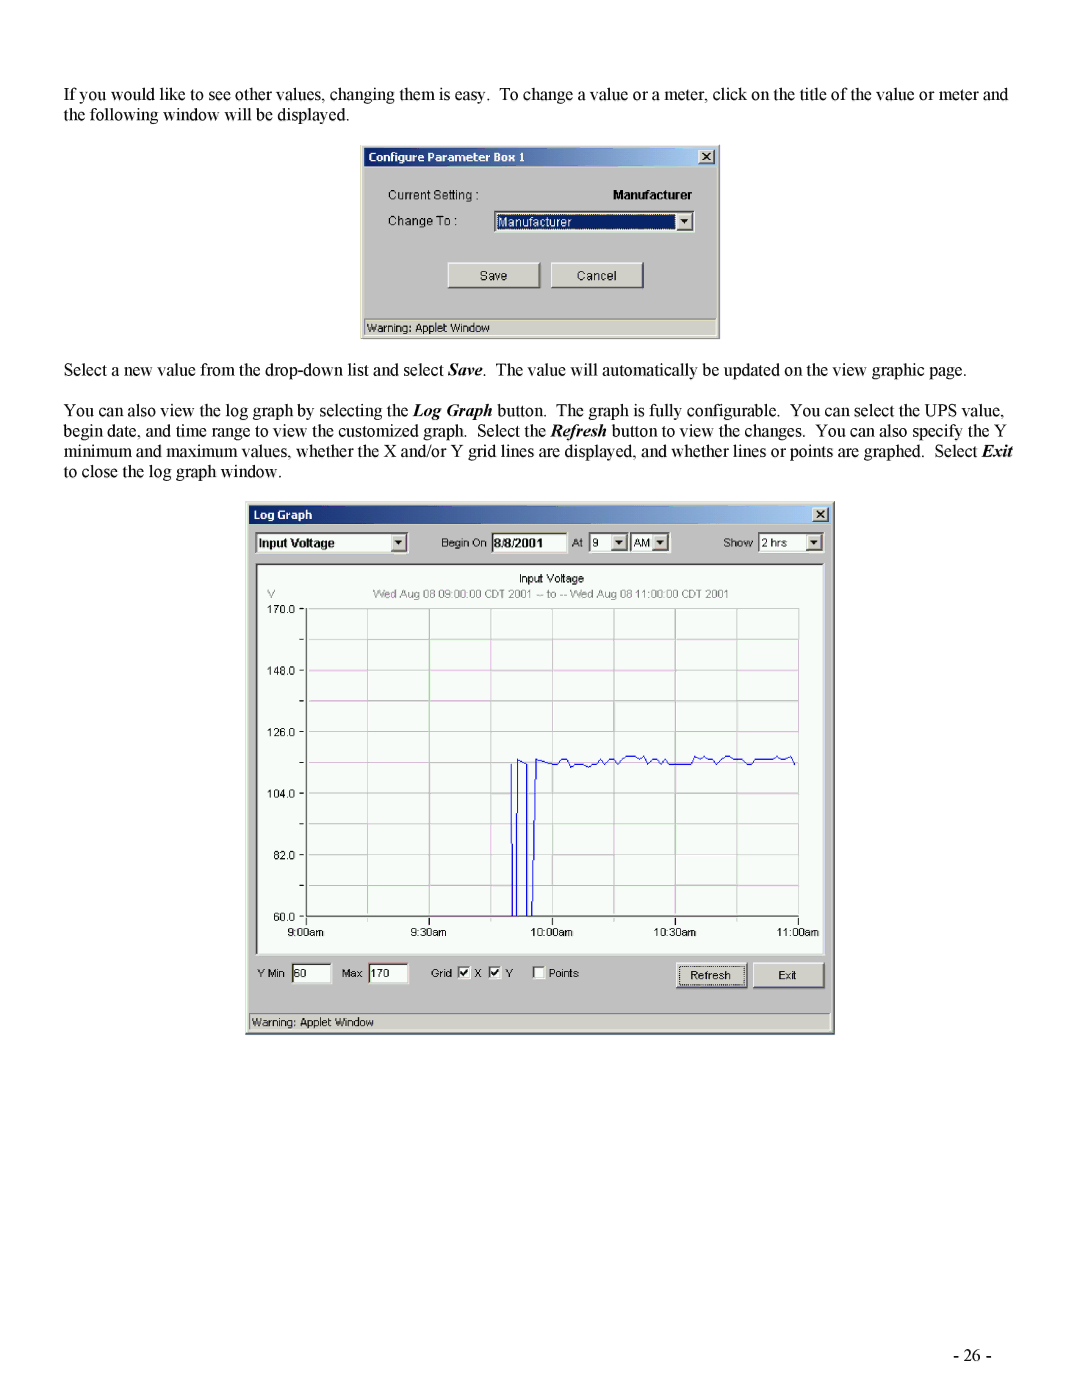
You can also view the log graph by selecting the Log Graph button. The graph is fully configurable. You can select the UPS value, begin date, and time range to view the customized graph. Select the Refresh button to view the changes. You can also specify the Y minimum and maximum values, whether the X and/or Y grid lines are displayed, and whether lines or points are graphed. Select Exit to close the log graph window.
- 26 -
