[HISTOGRAM]
A graph with brightness as horizontal axis and number of pixels at that brightness as vertical axis is displayed. It is possible to determine the exposure of the whole image by looking at the distribution in the graph.
Adjust the brightness using [IRIS]. (l65)
≥Change the mode to ![]() or
or ![]() .
.
≥Set the iA/MANUAL/FOCUS switch to manual mode. (l 63)
![]() MENU : [RECORD SETUP] # [HISTOGRAM] # desired setting
MENU : [RECORD SETUP] # [HISTOGRAM] # desired setting
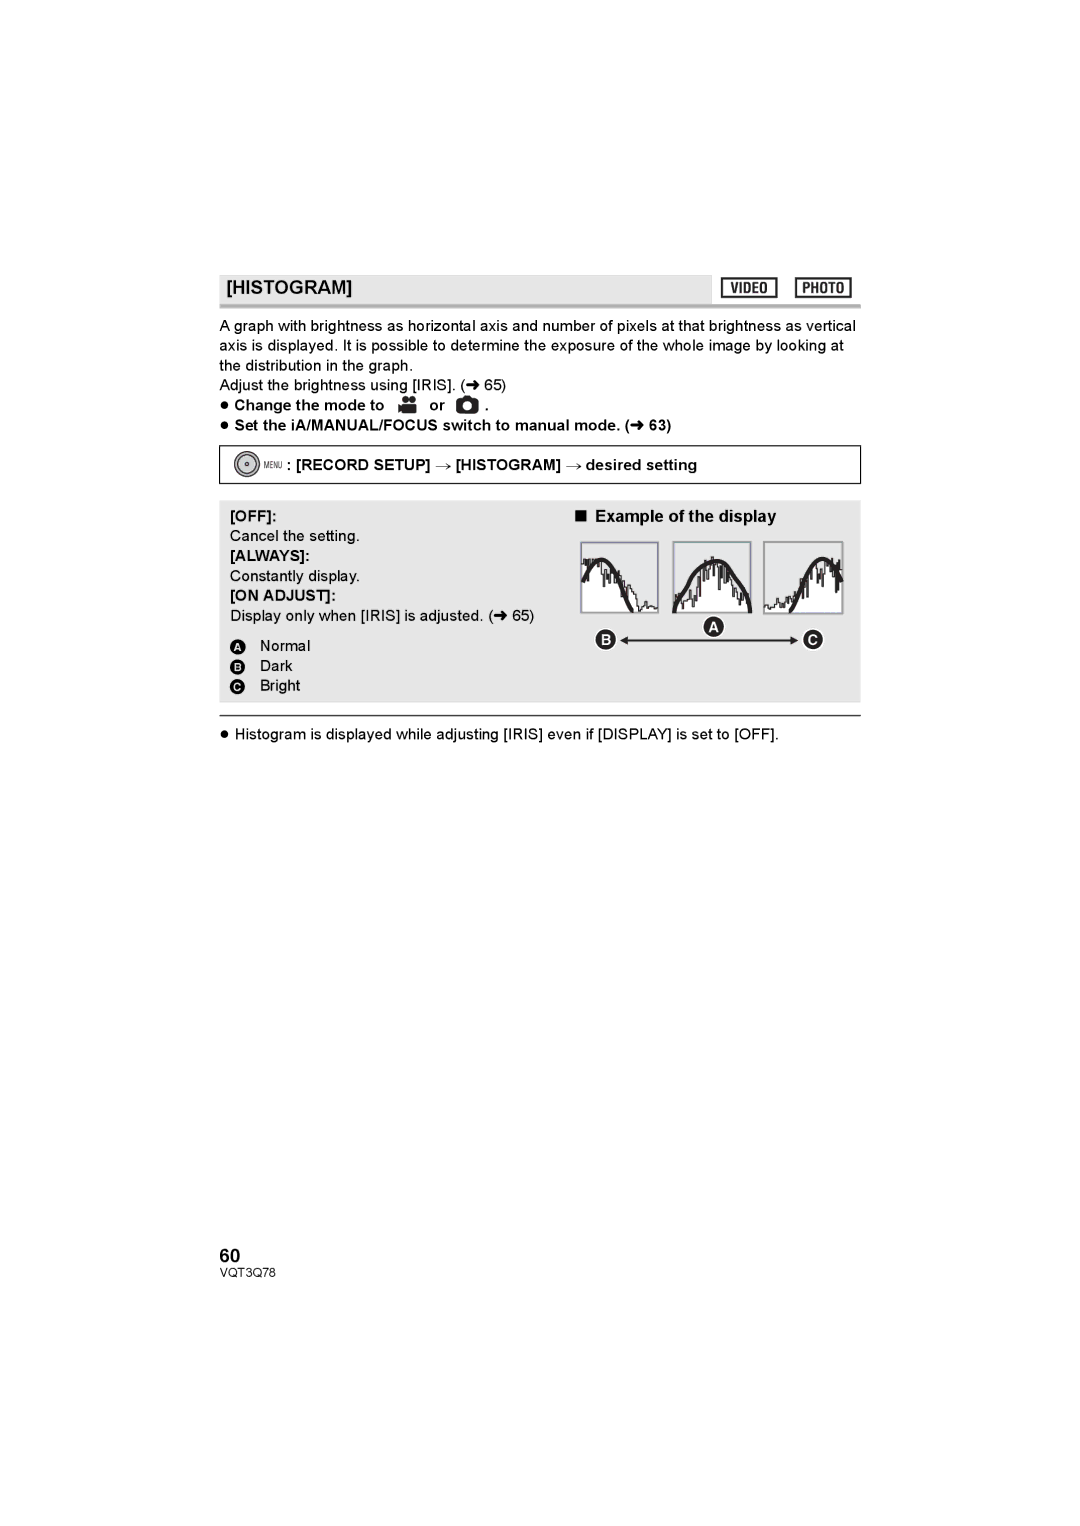
[OFF]: | ∫ Example of the display |
Cancel the setting.
[ALWAYS]:
Constantly display.
[ON ADJUST]:
Display only when [IRIS] is adjusted. (l65)
A Normal
BDark C Bright
≥Histogram is displayed while adjusting [IRIS] even if [DISPLAY] is set to [OFF].
60
VQT3Q78