Monitoring the DSU
Viewing Network Performance Statistics
Performance statistics for the network interface are available to:
HMonitor the current status of the network operations.
HView the DSU's performance statistics, which:
ÐAssist you in determining the duration of specific conditions.
ÐProvide a historical context for problem detection and analysis.
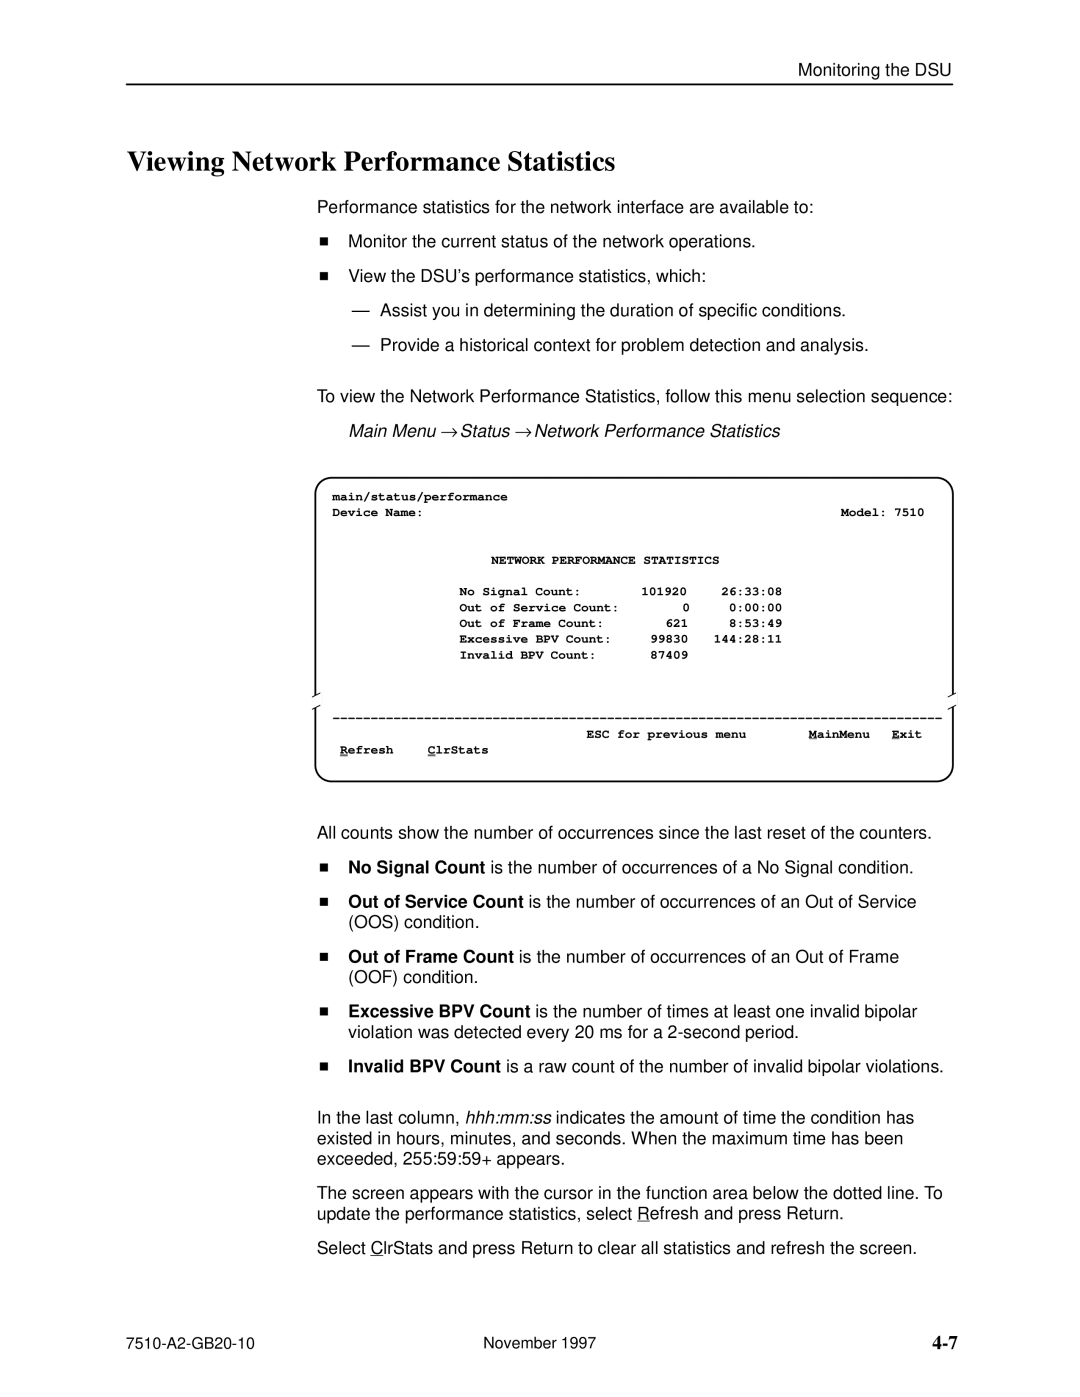
To view the Network Performance Statistics, follow this menu selection sequence: Main Menu → Status → Network Performance Statistics
main/status/performance |
|
|
Device Name: |
| Model: 7510 |
NETWORK PERFORMANCE STATISTICS | ||
No Signal Count: | 101920 | 26:33:08 |
Out of Service Count: | 0 | 0:00:00 |
Out of Frame Count: | 621 | 8:53:49 |
Excessive BPV Count: | 99830 | 144:28:11 |
Invalid BPV Count: | 87409 |
|
±±±±±±±±±±±±±±±±±±±±±±±±±±±±±±±±±±±±±±±±±±±±±±±±±±±È±±±±±±±±±±±±±±±±±±±±±±±±±±±±±
| ESC for previous menu | MainMenu Exit |
Refresh | C |
|
All counts show the number of occurrences since the last reset of the counters.
HNo Signal Count is the number of occurrences of a No Signal condition.
HOut of Service Count is the number of occurrences of an Out of Service (OOS) condition.
HOut of Frame Count is the number of occurrences of an Out of Frame (OOF) condition.
HExcessive BPV Count is the number of times at least one invalid bipolar violation was detected every 20 ms for a
HInvalid BPV Count is a raw count of the number of invalid bipolar violations.
In the last column, hhh:mm:ss indicates the amount of time the condition has existed in hours, minutes, and seconds. When the maximum time has been exceeded, 255:59:59+ appears.
The screen appears with the cursor in the function area below the dotted line. To update the performance statistics, select Refresh and press Return.
Select ClrStats and press Return to clear all statistics and refresh the screen.
November 1997 |
