manual
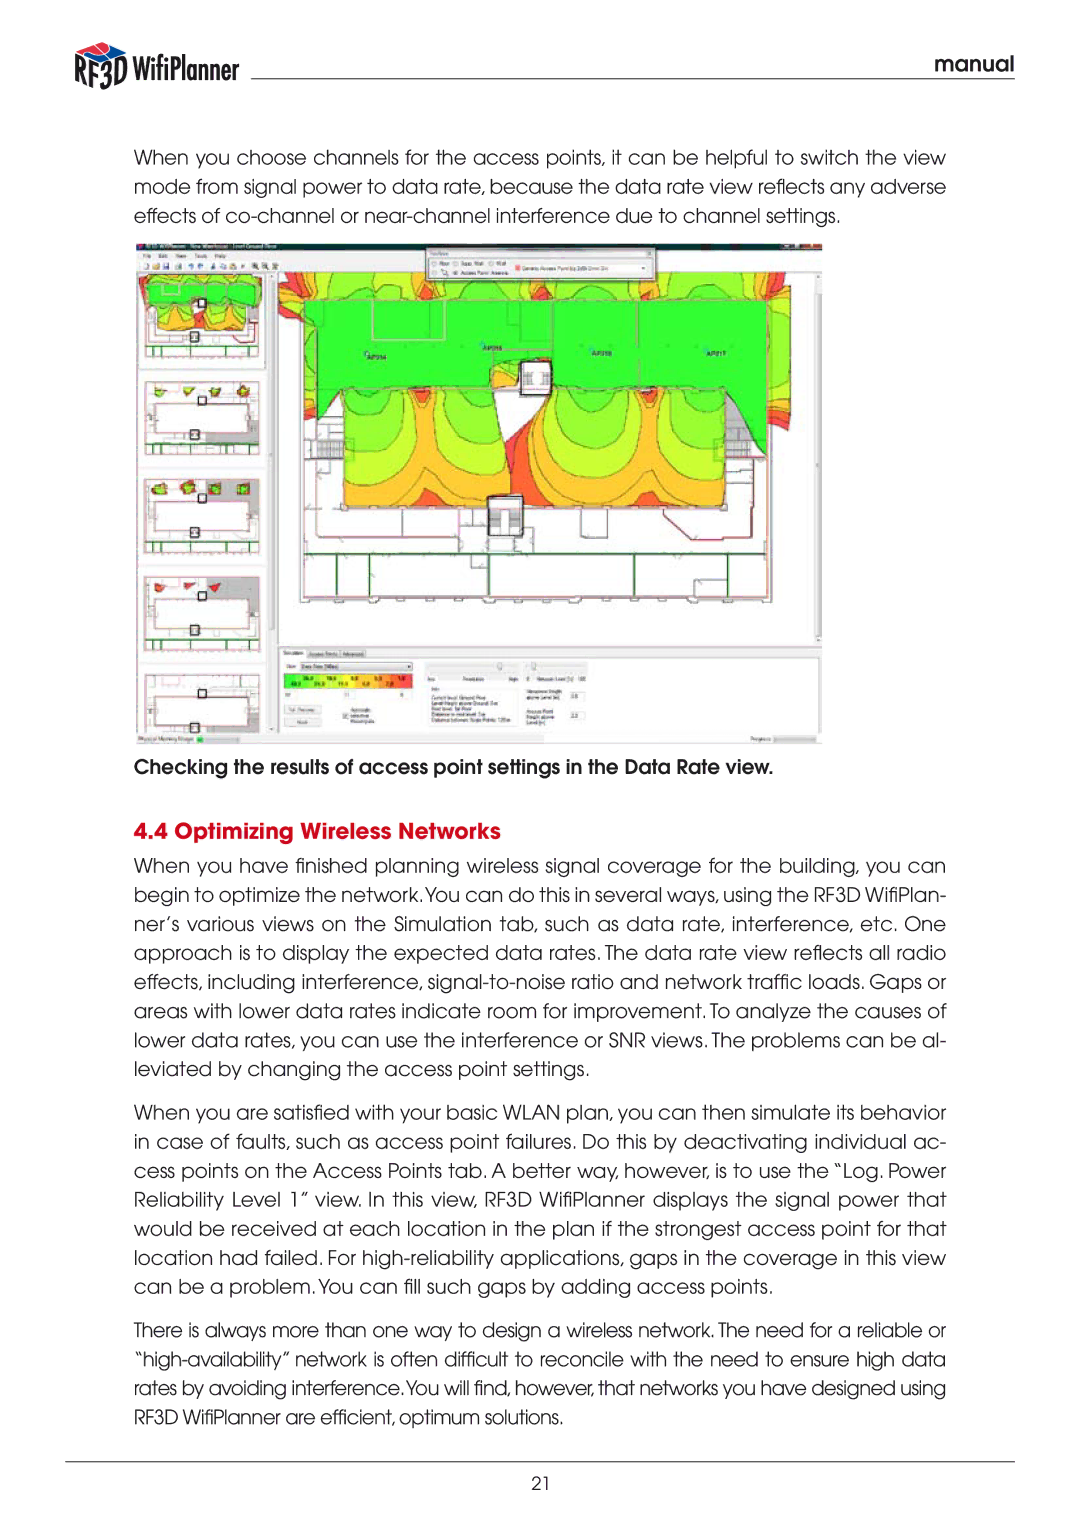
When you choose channels for the access points, it can be helpful to switch the view mode from signal power to data rate, because the data rate view reflects any adverse effects of
Checking the results of access point settings in the Data Rate view.
4.4 Optimizing Wireless Networks
When you have finished planning wireless signal coverage for the building, you can begin to optimize the network.You can do this in several ways, using the RF3D WifiPlan- ner’s various views on the Simulation tab, such as data rate, interference, etc. One approach is to display the expected data rates. The data rate view reflects all radio effects, including interference,
When you are satisfied with your basic WLAN plan, you can then simulate its behavior in case of faults, such as access point failures. Do this by deactivating individual ac- cess points on the Access Points tab. A better way, however, is to use the “Log. Power Reliability Level 1” view. In this view, RF3D WifiPlanner displays the signal power that would be received at each location in the plan if the strongest access point for that location had failed. For
There is always more than one way to design a wireless network. The need for a reliable or
21