Camera User Guide
Do not connect the USB cable yet
Preface
Test shooting
Key Features
Equipped with a high magnification 5.7× wide angle zoom lens
Skew Correction Mode helps straighten skewed images P.37
Scene Mode enables easy shooting P.37
Fps or 15 fps high-quality movies with sound P.91
Direct printing without the use of a computer P.52
Contents
Chapter Changing Camera Settings
Changing Camera Settings
Troubleshooting 160
Chapter Troubleshooting
Appendices 167
To copy the Software User Guide onto your hard disk
Using the Manuals
Camera User Guide This booklet
How to Use This Guide
Reference
Chapter
Before Shooting Getting Ready to Shoot Basic Shooting
Packing List
Before Shooting
USB Cable
Optional Accessories
AC Adapter AC-4c
Mode Selector
Names of Parts
Camera
Front View
Rear View
Example of LCD Monitor Display when Shooting Pictures
LCD Monitor Display
Example of LCD Monitor Display During Playback
Dpof
About the Battery
Rechargeable Battery DB-60 supplied
Getting Ready to Shoot
Approximate number of shots you can take on a single charge
Battery Level Indication
Battery Mark Description
SD Memory Card available in stores
Where images are recorded
Write-protecting your images
Plug the battery charger into an outlet
Charging the Rechargeable Battery
Charger Lamp Description
Loading the Rechargeable Battery and SD Memory Card
Insert the rechargeable battery
Close the battery/card cover and slide it back into place
Removing the Rechargeable Battery
Rechargeable battery charging time
Removing the SD Memory Card
Turning the Power On/Off
To turn the power on
To turn the power off
Press the Power button
Setting the Language
Turn the power on for the first time after purchase
Setting the Date and Time
Press the !#$ buttons to set the year, month, date and time
FORMAT, choose the date and time format
Check the display and then press the C/Dbutton
Synchro-Monitor Mode
Changing the Display
Maximizing the LCD Monitor Brightness
Term
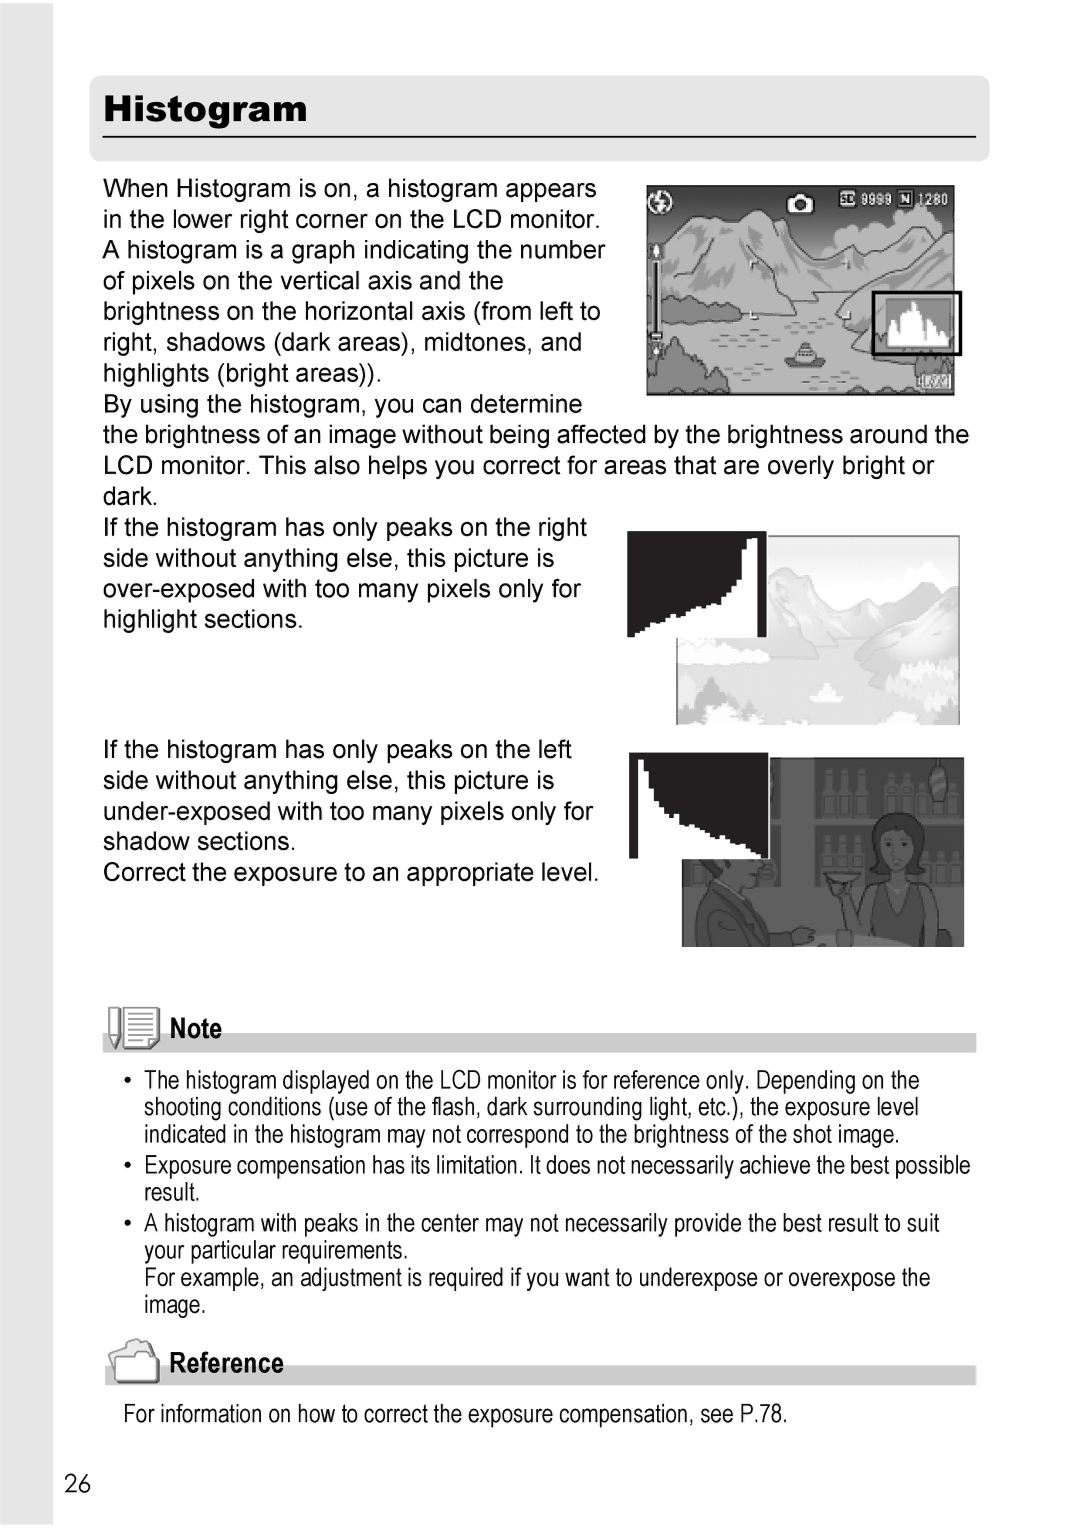
Histogram
Basic Shooting
Holding the Camera
Preventing Camera Shake
Quickly Shooting Pictures Full-press
Checking the Focus and Shooting Half-press
Press the Power button to turn the camera on
Frame Color Auto Focus/Flash Lamp
Gently press the shutter release button all the way
When the Subject is Not Centered Shooting with Focus Lock
Reference
Using the Zoom Function
Using the Digital Zoom
Shooting Close-Ups Macro Shooting
With the camera ready to shoot, press the N Macro button
Using the Flash
Flash Modes
Portrait
Text Mode
Changing Scene Mode
Returning to Normal Shooting Mode
Shooting in Zoom Macro Mode
Switch the Mode Selector to Press the Scene button
Using the Skew Correction Mode
Playing Back Images
Reviewing the Image You Just Took Quick Review
Still Image Mode, press the Q Quick Review button
Quick Review
Turning on the camera in Playback Mode
Where images are played back from
Viewing Your Images
Press the 6 Playback button
Playing Back Images in the Three- frame View
Switching to Single-Picture Display
Press the 9 Thumbnail Display button
Switching the Playback Screen
Playback screen changes as follows
Thumbnail Display
Displaying One Photo
Press the 9 Thumbnail Display
Button
Magnifying Images
Enlarged View
Viewing on a Television
Reference
Deleting Files
Deleting Unwanted Files Still Images/ Movies/Sounds
If You Selected Delete ONE
If You Selected Delete ALL
Deleting Multiple Files at One Time
Repeat to select all the files you want to delete
Using the Various Shooting Playback Functions
Direct Printing
Connecting the Camera to a Printer
Direct Print Function
Printing Still Images
Printing One or All Still Images
Check that the printer is ready to print
Press the ADJ. button
Repeat Steps 7 and 8 to change other settings as required
Item Name Description
Printing Several Still Images
Press the #$ buttons to select the next image for printing
Direct Print menu appears
Settings Using the ADJ. Button
Using the ADJ. Adjust Button
Various Shooting Functions
Shooting Setting Menu
Setting Options Refer to
Using the Shooting Setting Menu
With the camera ready to shoot, press the C/D button
Press the ! buttons to select the desired menu item
After selecting a menu item, press the $ button
Combining Picture Quality Mode and Image Size
Picture Quality Modes Symbol Description
Choosing Picture Quality Mode/Image Size
PIC QUALITY/SIZE
Turn the Mode Selector to Press the C/Dbutton
Focusing Modes Symbol Description
Changing the Focusing Mode
Focus Multi AF/SPOT AF
Changing the Auto Focus Mode Multi AF/SPOT AF
Switch the Mode Selector to Press the C/Dbutton
Setting Manual Focus
Manual Focus Shooting Focus MF
Shooting with Manual Focus
Press the button as required
Press the $ button to display the focus bar
Press the shutter release button to shoot the picture
Shooting at a Fixed Distance Focus SNAP/Infinity
Light Metering Modes Symbol Description
Changing the Light Metering Photometry
Changing the Edge Quality of Still Images
Sharpness
Setting the Color Depth Color Depth
Shooting Consecutively with Different Exposures Auto Bracket
Shooting Consecutively with Different White Balance WB-BKT
Reference
Using Long Time Exposure Time Exposure
Shooting Pictures Automatically at Set Intervals Interval
To stop shooting, press the C/Dbutton
Using the Various Shooting and Playback Functions
Image with Sound
Shooting a Still Image with Sound
Press the shutter release button to finish recording
Inserting the Date into a Still Image
Date Imprint
When your subject is whitish
When your subject is darkish
Changing the Exposure Exposure Comp
For backlighting
Using Natural and Artificial Lighting
Switch the Mode Selector to Press the ADJ. button
Press the ! buttons to select a mode other than
White Balance
Setting the White Balance Manually Manual Setting
Changing the Sensitivity ISO Setting
Limiting the Shutter Speed
Slow Shutter LMT
Restore Defaults
Press the ! buttons to select the desired density setting
Changing Shading for Shooting Text Density
Using the AF Target Shift Function
Using the Self-Timer
Switch the Mode Selector to Press the t Self-timer button
Stream-CONT
Memory-reversal-CONT
F2816 N2816 F32 F2048 N2048 F1280 N1280 N640
Cont
S Multi-Shot
M Multi-Shot
Release your finger from the shutter release button
Last shot taken is displayed
Shooting/Playing Back Movies
Shooting Movies
While shooting movies, operation sounds may be recorded
Setting the Frame Rate
Internal 32 MB 64 MB 128 MB 256 MB 512 MB Memory
Playing Back Movies
Select to the movie you want to View using the #$ buttons
Movie Frames
Recording Sound
Recording/Playing Back Sound
Press the shutter release button to stop recording
Playing Back Sound
Playback Setting Menu
Using the Playback Setting Menu
Slide Show
Displaying Photos in Order Automatically
Press the button, select Slide Show and press the $ button
Write-protecting Files Protect
Protecting Files
Protecting All Files
Press the 6 Playback button Press the C/Dbutton
Protecting Multiple Files at Once
Repeat to select all the files you want to protect
Using a Printing Service Dpof
Setting Dpof for the Displayed Still Image
Setting Dpof for All Still Images
Setting Dpof for Multiple Still Images
Changing the Image Size Resize
Original Resized
Copy to Card
108
Changing Camera Settings
Setup Menu
Press the $ button
Using the Setup Menu
Press the ! buttons to select the desired item
Formatting the SD Memory Card Format Card
Display the Setup menu
Protecting your images from being deleted
Formatting the Internal Memory Format INT. MEM
Adjusting the Brightness of the LCD Monitor
Press the ! buttons to adjust the brightness
When you reach the desired brightness, press the C/D button
LCD Brightness
Available Settings Refer to
Assigning a Function to the ADJ. Button ADJ BTN. SET.1/2
Auto Power OFF
Changing the Auto Power Off Setting
Available Settings
Changing the Beep Sound Setting
Beep Sound
Changing the Beep Sound Volume VOL. Settings
Changing Image Confirmation Time LCD Confirm
Changing File Name Settings Sequential no
118
119
Setting the Date and Time Date Settings
Press the button to select
Changing the Display Language Language
$ button
To change the playback format, follow the steps below
Changing the Step Zooming Setting Step Zoom
Displaying a Settings Change Warning
Shtg Stgs Warng
USB Connection Mode
Changing the USB Setting
USB Connection
To change the USB setting, follow the steps below
127
Disconnecting the Camera from Your Computer Windows
Disconnecting the Camera from Your Computer Macintosh
Enlarging Icon Display Enlge Photo Icon
Registering the Power-on Settings
REG. MY Settings
Registering My Settings
Select SETTING1 or SETTING2 and press the C/Dbutton
Start Settings
Changing the Startup Settings
Settings Retained by My Setting Function
132
Installing Software
Downloading Images to Your Computer
Installing the Provided Software For Windows
Software that can be installed from the Caplio Software
When Installing the software is clicked P.139
Item Name Description Refer to
Software Windows Description
When Installing DeskTopBinder Lite is clicked P.141
Software Description Refer to
System Requirements for Using the Provided Software
CPU
Installing the Software on Your Computer
Click Installing the software
Confirm the language, and then click OK
Click Next
Confirm where you want to install and then click Next
Click Finish Restart your computer Reference
Installing the DeskTopBinder Lite
Click Installing DeskTopBinder Lite
Click OK Click DeskTopBinder Lite
Connecting the Camera to Your Computer
Downloading Images Using Ricoh Gate La
For Windows XP
Disconnecting the Camera from Your Computer
Transferring Images in Mass Storage Mode
Change USB Connection to Mass STR on the Setup menu
Drag the displayed drive to the Trash. InstallingSoftware
Images in an SD Memory Card
Downloading Images from an SD Memory Card
Card Reader
Installing Acrobat Reader
Click Browse CD-ROM Content
Installing DirectX
Uninstalling the Software
Uninstalling ImageMixer
Installing the Provided Software For Macintosh
Software Mac Description
When Installing the software is clicked
When Browse User’s Manual Software Version is clicked
System Requirements for Using Provided Software
Installing the Software on Your Computer Mac OS 8.6 to
Double-click Installer
Click Installing the software Click OK to update
Click Continue
Installing the Software on Your Computer Mac OS X 10.1.2 to
Click the folder for your OS
Double-click Caplio Mounter
Click the key icon
Click Continue Installation
Troubleshooting
Troubleshooting 160 Appendices 167
Troubleshooting the Camera
Troubleshooting
Power Supply
Shooting
161
162
Playback/Deleting
About the Software Other Problems
When this warning message is displayed
Troubleshooting
If you clicked the Keep Blocking button
If you clicked the Ask Me Later button
Specifications
Appendices
General
Camera Parts
Terminals
Image Data Record/Playback Part
Memory Cards for Recording and Playback
Optional Accessories
Using the AC Adapter sold separately
Open the battery/card cover Insert the AC adapter coupler
Plug the power cord into an outlet
Disconnecting the AC Adapter
Using Scene Modes with Functions
Scene Mode Flash Macro Shooting
Available Menu Items By Mode
Movie Mode
Scene Mode
Setting
Menu Function Setting is saved, × setting is restored
172
173
Using Your Camera Abroad
Warranty
AC Adapter Model AC-4c
Playback on Television in Other Regions
Conditions in which condensation may easily occur
Care and Storage
Care
Error Messages
Error Message Cause and Action
Warranty and Servicing
Information to the User
USA FCC Part15 Class B
Index
Language
181
Telephone Support Numbers in Europe
L735

 Reference