45
Viewing measurements on the display
Panel Layout View(charts/graphs)
When you are in the data finder page (see above), select either the Analyze button or
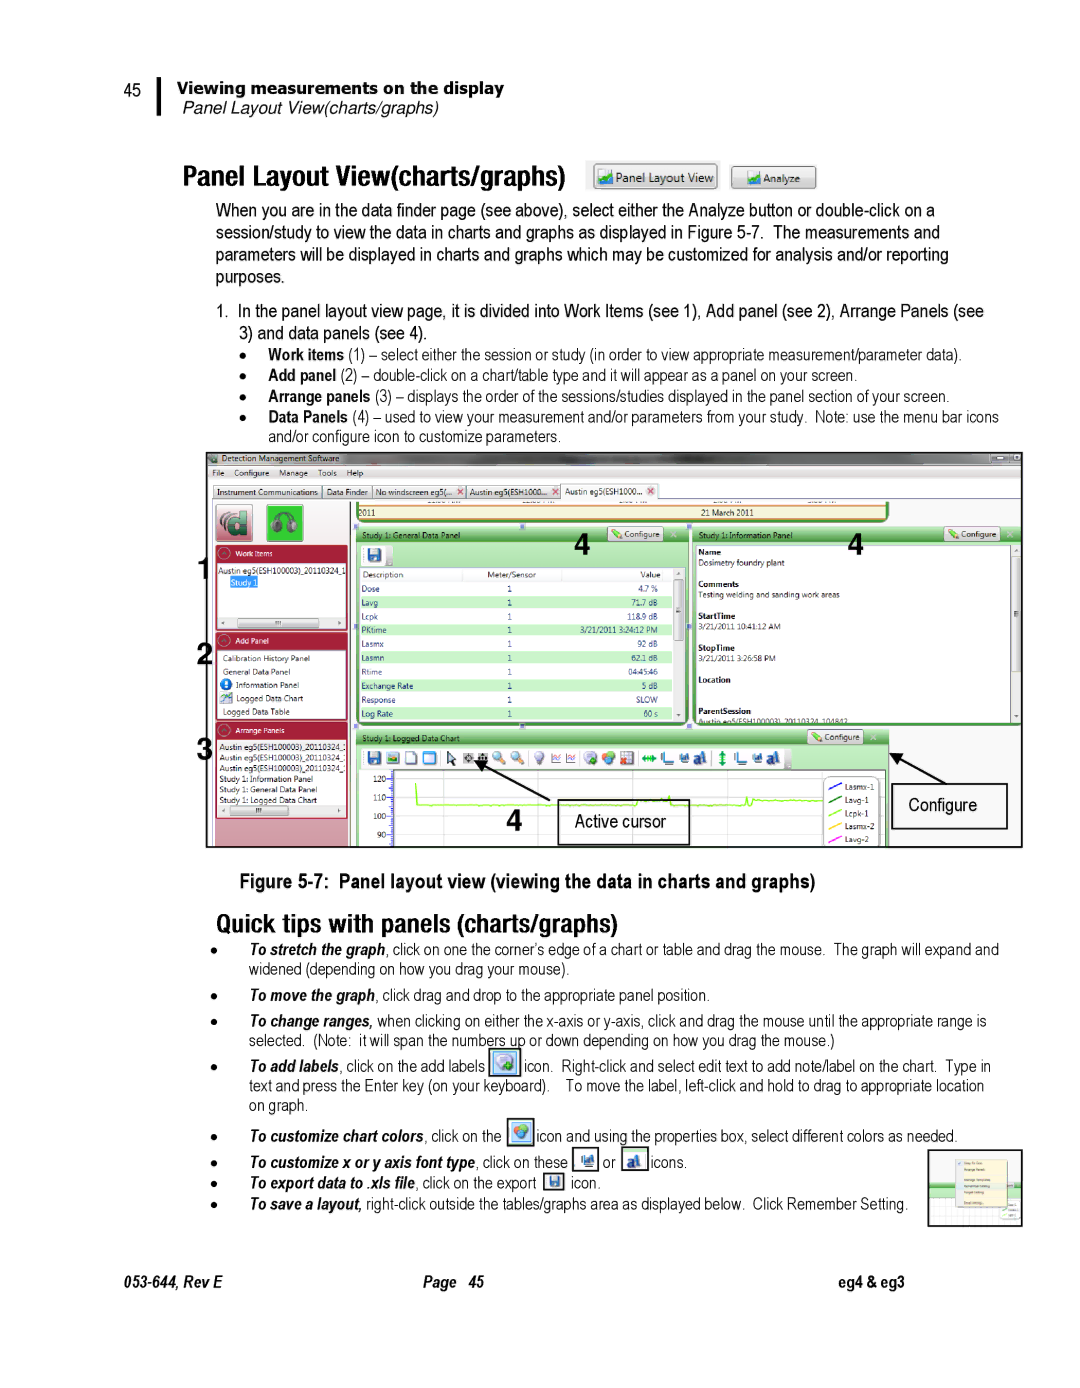
1. In the panel layout view page, it is divided into Work Items (see 1), Add panel (see 2), Arrange Panels (see 3) and data panels (see 4).
∙Work items (1) – select either the session or study (in order to view appropriate measurement/parameter data).
∙Add panel (2) –
∙Arrange panels (3) – displays the order of the sessions/studies displayed in the panel section of your screen.
∙Data Panels (4) – used to view your measurement and/or parameters from your study. Note: use the menu bar icons and/or configure icon to customize parameters.
1
2
3
4
4
Active cursor
4
Configure
Figure 5-7: Panel layout view (viewing the data in charts and graphs)
∙To stretch the graph, click on one the corner’s edge of a chart or table and drag the mouse. The graph will expand and widened (depending on how you drag your mouse).
∙To move the graph, click drag and drop to the appropriate panel position.
∙To change ranges, when clicking on either the
∙To add labels, click on the add labels ![]()
![]() icon.
icon.
∙To customize chart colors, click on the ![]()
![]() icon and using the properties box, select different colors as needed.
icon and using the properties box, select different colors as needed.
∙To customize x or y axis font type, click on these ![]()
![]() or
or ![]()
![]() icons.
icons.
∙To export data to .xls file, click on the export ![]()
![]() icon.
icon.
∙To save a layout,
Page 45 | eg4 & eg3 |