Contents

1. Making Basic Measurements

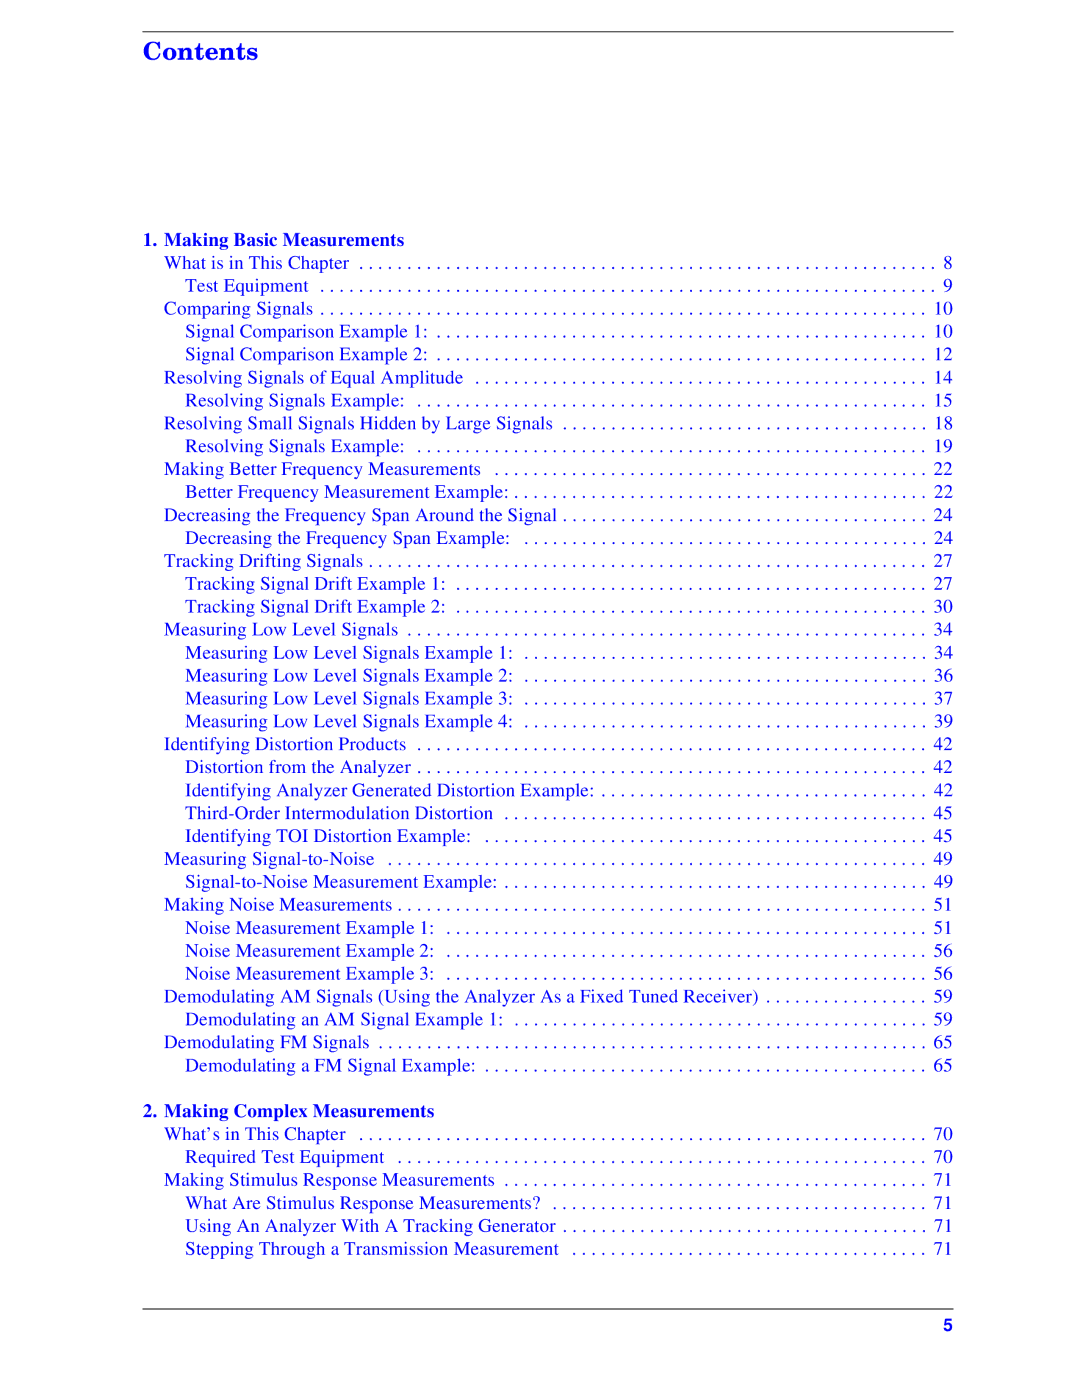
What is in This Chapter . . . . . . . . . . . . . . . . . . . . . . . . . . . . . . . . . . . . . . . . . . . . . . . . . . . . . . . . . . . . 8 Test Equipment . . . . . . . . . . . . . . . . . . . . . . . . . . . . . . . . . . . . . . . . . . . . . . . . . . . . . . . . . . . . . . . . 9 Comparing Signals . . . . . . . . . . . . . . . . . . . . . . . . . . . . . . . . . . . . . . . . . . . . . . . . . . . . . . . . . . . . . . . 10 Signal Comparison Example 1: . . . . . . . . . . . . . . . . . . . . . . . . . . . . . . . . . . . . . . . . . . . . . . . . . . . 10 Signal Comparison Example 2: . . . . . . . . . . . . . . . . . . . . . . . . . . . . . . . . . . . . . . . . . . . . . . . . . . . 12 Resolving Signals of Equal Amplitude . . . . . . . . . . . . . . . . . . . . . . . . . . . . . . . . . . . . . . . . . . . . . . . 14 Resolving Signals Example: . . . . . . . . . . . . . . . . . . . . . . . . . . . . . . . . . . . . . . . . . . . . . . . . . . . . . 15 Resolving Small Signals Hidden by Large Signals . . . . . . . . . . . . . . . . . . . . . . . . . . . . . . . . . . . . . . 18 Resolving Signals Example: . . . . . . . . . . . . . . . . . . . . . . . . . . . . . . . . . . . . . . . . . . . . . . . . . . . . . 19 Making Better Frequency Measurements . . . . . . . . . . . . . . . . . . . . . . . . . . . . . . . . . . . . . . . . . . . . . 22 Better Frequency Measurement Example: . . . . . . . . . . . . . . . . . . . . . . . . . . . . . . . . . . . . . . . . . . . 22 Decreasing the Frequency Span Around the Signal . . . . . . . . . . . . . . . . . . . . . . . . . . . . . . . . . . . . . . 24 Decreasing the Frequency Span Example: . . . . . . . . . . . . . . . . . . . . . . . . . . . . . . . . . . . . . . . . . . 24 Tracking Drifting Signals . . . . . . . . . . . . . . . . . . . . . . . . . . . . . . . . . . . . . . . . . . . . . . . . . . . . . . . . . . 27 Tracking Signal Drift Example 1: . . . . . . . . . . . . . . . . . . . . . . . . . . . . . . . . . . . . . . . . . . . . . . . . . 27 Tracking Signal Drift Example 2: . . . . . . . . . . . . . . . . . . . . . . . . . . . . . . . . . . . . . . . . . . . . . . . . . 30 Measuring Low Level Signals . . . . . . . . . . . . . . . . . . . . . . . . . . . . . . . . . . . . . . . . . . . . . . . . . . . . . . 34 Measuring Low Level Signals Example 1: . . . . . . . . . . . . . . . . . . . . . . . . . . . . . . . . . . . . . . . . . . 34 Measuring Low Level Signals Example 2: . . . . . . . . . . . . . . . . . . . . . . . . . . . . . . . . . . . . . . . . . . 36 Measuring Low Level Signals Example 3: . . . . . . . . . . . . . . . . . . . . . . . . . . . . . . . . . . . . . . . . . . 37 Measuring Low Level Signals Example 4: . . . . . . . . . . . . . . . . . . . . . . . . . . . . . . . . . . . . . . . . . . 39 Identifying Distortion Products . . . . . . . . . . . . . . . . . . . . . . . . . . . . . . . . . . . . . . . . . . . . . . . . . . . . . 42 Distortion from the Analyzer . . . . . . . . . . . . . . . . . . . . . . . . . . . . . . . . . . . . . . . . . . . . . . . . . . . . . 42 Identifying Analyzer Generated Distortion Example: . . . . . . . . . . . . . . . . . . . . . . . . . . . . . . . . . . 42 Third-Order Intermodulation Distortion . . . . . . . . . . . . . . . . . . . . . . . . . . . . . . . . . . . . . . . . . . . . 45 Identifying TOI Distortion Example: . . . . . . . . . . . . . . . . . . . . . . . . . . . . . . . . . . . . . . . . . . . . . . 45 Measuring Signal-to-Noise . . . . . . . . . . . . . . . . . . . . . . . . . . . . . . . . . . . . . . . . . . . . . . . . . . . . . . . . 49 Signal-to-Noise Measurement Example: . . . . . . . . . . . . . . . . . . . . . . . . . . . . . . . . . . . . . . . . . . . . 49 Making Noise Measurements . . . . . . . . . . . . . . . . . . . . . . . . . . . . . . . . . . . . . . . . . . . . . . . . . . . . . . . 51 Noise Measurement Example 1: . . . . . . . . . . . . . . . . . . . . . . . . . . . . . . . . . . . . . . . . . . . . . . . . . . 51 Noise Measurement Example 2: . . . . . . . . . . . . . . . . . . . . . . . . . . . . . . . . . . . . . . . . . . . . . . . . . . 56 Noise Measurement Example 3: . . . . . . . . . . . . . . . . . . . . . . . . . . . . . . . . . . . . . . . . . . . . . . . . . . 56 Demodulating AM Signals (Using the Analyzer As a Fixed Tuned Receiver) . . . . . . . . . . . . . . . . . 59 Demodulating an AM Signal Example 1: . . . . . . . . . . . . . . . . . . . . . . . . . . . . . . . . . . . . . . . . . . . 59 Demodulating FM Signals . . . . . . . . . . . . . . . . . . . . . . . . . . . . . . . . . . . . . . . . . . . . . . . . . . . . . . . . . 65 Demodulating a FM Signal Example: . . . . . . . . . . . . . . . . . . . . . . . . . . . . . . . . . . . . . . . . . . . . . . 65

2. Making Complex Measurements


What’s in This Chapter

70

Required Test Equipment

70

Making Stimulus Response Measurements

71

What Are Stimulus Response Measurements?

71

Using An Analyzer With A Tracking Generator

71

Stepping Through a Transmission Measurement

71

5

Page 5
Image 5
Agilent Technologies E7405A, E7402A, E7404A, E7403A, E7401A manual Contents

E7402A, E7405A, E7404A, E7401A, E7403A specifications

Agilent Technologies, a leader in test and measurement solutions, offers a range of spectrum analyzers designed to meet the evolving demands of the electronics industry. The E7403A, E7401A, E7404A, E7405A, and E7402A are prominent models that embody advanced features and technologies, enhancing performance, accuracy, and user experience.

The E7403A is recognized for its high-quality performance and wide frequency range. This model offers frequency coverage from 9 kHz to 3 GHz, making it suitable for both commercial and academic research applications. With a phase noise of -100 dBc/Hz at 10 kHz offset, it delivers exceptional sensitivity. The E7403A also features a built-in tracking generator, facilitating effective signal generation for testing.

Next in line, the E7401A provides similar frequency coverage but is optimized for portable functionality. Weighing significantly less than its counterparts, it is easy to transport, making it ideal for field applications. Users benefit from its fast sweep speed of up to 3 GHz, which is crucial in quickly identifying and analyzing signals.

The E7404A excels in its comprehensive analysis capabilities. With a frequency range extending up to 6 GHz, it supports more demanding applications, including wireless communications and satellite technology. Its advanced digital signal processing capabilities enable the analysis of complex modulated signals, providing engineers with the data needed to troubleshoot and optimize system performance.

The E7405A is a highly versatile model that offers frequency coverage from 9 kHz to 20 GHz. This wide frequency range, combined with high dynamic range, supports the testing of various electronic devices and systems. It features advanced measurement options including occupied bandwidth, adjacent channel power, and sensitivity measurements, which are critical for compliance testing in communication systems.

Lastly, the E7402A is designed for users who require a spectrum analyzer with enhanced functionality at a competitive price. It reaches frequencies of up to 1.5 GHz, making it suitable for various applications including RF design, development, and manufacturing. Its user-friendly interface ensures that both novice and experienced users can navigate its features with ease.

In conclusion, Agilent Technologies' E7403A, E7401A, E7404A, E7405A, and E7402A spectrum analyzers provide a robust set of features tailored to meet diverse industry needs. Utilizing sophisticated technologies, these models ensure precise and efficient signal analysis, making them indispensable tools for engineers and researchers in the fast-paced world of electronics.