User Guide for Internetwork Performance Monitor
Corporate Headquarters
User Guide for Internetwork Performance Monitor
N T E N T S
Iii
Defining a Source Device
Adding a New Target Deleting Targets
Setting the Baseline
Viewing Jitter Data
Vii
IPM Internal Commands
Viii
Convention
Audience
Conventions
Italic font
Describes the product documentation that is available
Installation Guide for Internetwork Performance Monitor
Product Documentation
Release Notes for Internetwork Performance Monitor
Product Documentation DVD
Obtaining Documentation
Cisco.com
Ordering Documentation
Cisco Product Security Overview
Reporting Security Problems in Cisco Products
Documentation Feedback
Xii
Cisco Technical Support & Documentation Website
Obtaining Technical Assistance
Xiii
Obtaining Additional Publications and Information
Submitting a Service Request
Definitions of Service Request Severity
Xiv
Preface Obtaining Additional Publications and Information
Xvi
What is IPM?
Overview of IPM
Key Terms and Concepts
How Does IPM Work?
Client/Server Architecture
IPM Client/Server Architecture
New Features in IPM
OL-11291-01
Starting IPM Server on Solaris
Starting IPM
To start the IPM server on a Solaris system, enter
Starting IPM Client From the CiscoWorks Homepage
Starting IPM Client
Starting IPM Server on Windows
To start the IPM server on a Windows system, enter
This section describes the following
Starting IPM as a Standalone Client
To start only the IPM client on a Solaris system, enter
IPM Main Window
Enter a password and press Enter
To enable IPM passwords on Solaris
IPM prompts you to enter a password
IPM prompts you to confirm the password
Starting IPM Standalone Client on Windows
To enable an IPM password on Windows
Log in as the administrator
Running Simultaneous IPM Sessions
Configuring the IPM Components
Defining a Source Device
Configuration Window-Source Configuration
Target Configuration Window
Defining a Target
User Guide for Internetwork Performance Monitor
Defining a Collector
Click Collectors
Collector Configuration Window
Set Date Range Window
Payload is set to
Operation Description
Measures end-to-end latency for acquiring a new Dhcp lease
Name of the host to look up for the DNS request
Operation Description
Extra DNS Settings Window
Viewing Network Performance Statistics
Viewing Network Performance Statistics in Real Time
Real Time Statistics window either -8or -9 appears
Action Key Combination
Jitter Real Time Statistics Window
Viewing Historical Network Performance Statistics
10 Statistics Data Filter Window
Historical Statistics window -11, -12, or -13 appears
11 Historical Statistics Window-Echo Collector
12 Historical Statistics Window-Path Echo Collector
13 Historical Statistics Window-Enhanced UDP Collector
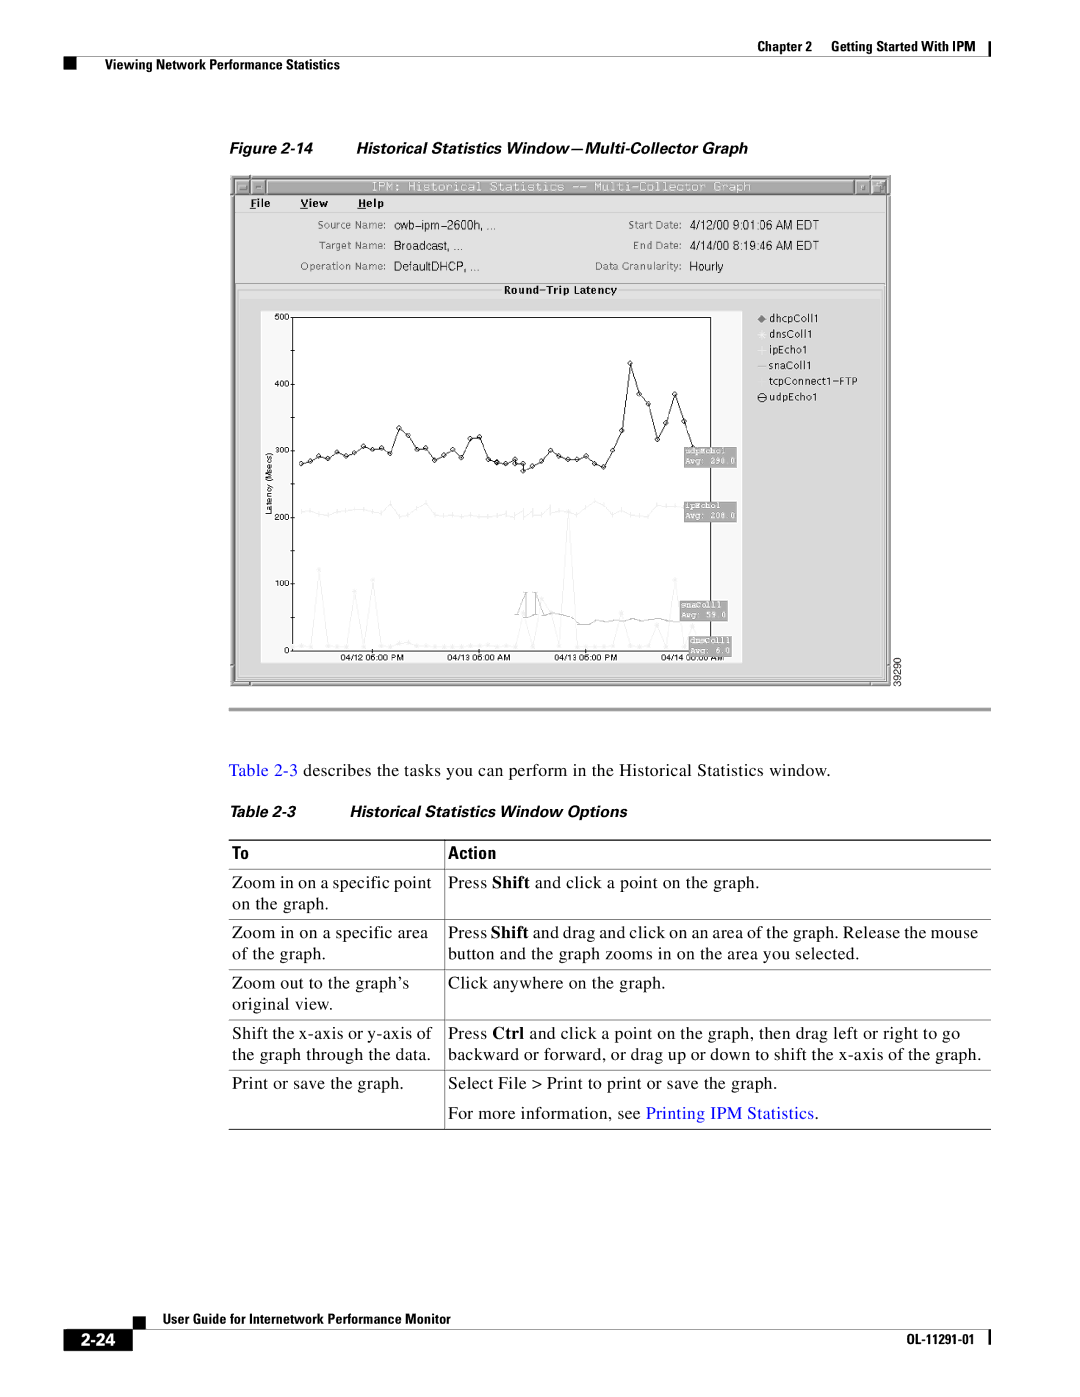
Action
14 Historical Statistics Window-Multi-Collector Graph
For more information, see Understanding Previous Range
Understanding Next Range
Printing IPM Statistics
IPM sends the output to the printer or file you specified
Exiting the IPM Client
Using IPM to Measure Network Performance
Measuring Network Performance for Dhcp
Dhcp Operation Configuration window -1 appears
Defining a Dhcp Operation
Dhcp Operation Configuration Window
Viewing Statistics for Dhcp
Dhcp Historical Statistics window -2 appears
Measuring Network Performance for DLSw
Defining a DLSw Operation
DLSw Operation Configuration window -3 appears
DLSw Operation Configuration Window
Viewing Statistics for DLSw
DLSw Historical Statistics window -4 appears
Measuring Network Performance for DNS
Defining a DNS Operation
Viewing Statistics for DNS
DNS Historical Statistics window -6 appears
DNS Historical Statistics Window
Measuring Network Performance for Http
Http Operation Configuration window -7 appears
Defining an Http Operation
Http Operation Configuration Window
Viewing Statistics for Http
Http Historical Statistics window -8 appears
Http Historical Statistics Window
Measuring Network Performance for FTP
Defining an FTP Operation
FTP Operation Configuration window -9 appears
FTP Configuration Window
Viewing Statistics for FTP
FTP Historical Statistics window -10 appears
Measuring Network Performance for IP
10 FTP Historical Statistics Window
Echo Operation Configuration window -11 appears
Measuring End-to-End Performance for IP
SNA Sscp
Viewing End-to-End Statistics for IP
IP Echo Historical Statistics window -12 appears
Measuring Hop-by-Hop Performance for IP
Defining an IP Path Echo Operation
Path Echo Operation Configuration window -13 appears
Click Path Echo
Viewing Hop-by-Hop Statistics for IP
14 IP Path Echo Historical Statistics Window-All Paths
User Guide for Internetwork Performance Monitor
17shows a sample Combined Path List window
18shows a sample Combined Hop List window
Measuring Network Performance for SNA
18 IP Path Echo Combined Hop List Window
Defining an SNA Echo Operation
Viewing Statistics for SNA
SNA Echo Historical Statistics window -19 appears
19 SNA Echo Historical Statistics Window
Measuring Network Performance for TCP
TCP Operation Configuration window -20 appears
Defining a TCP Operation
20 TCP Operation Configuration Window
Viewing Statistics for TCP
TCP Historical Statistics window -21 appears
Measuring Network Performance for UDP
UDP Operation Configuration window -22 appears
Defining a UDP Operation
22 UDP Operation Configuration Window
Viewing Statistics for UDP
UDP Historical Statistics window -23 appears
Measuring Network Performance for Enhanced UDP
Enhanced UDP Operation Configuration window -24 appears
Defining an Enhanced UDP Operation
Viewing Statistics for Enhanced UDP
Enhanced UDP Historical Statistics window -25and -26 appears
25 Enhanced UDP Historical Statistics Window-Part
26 Enhanced UDP Historical Statistics Window-Part
OL-11291-01
Modifying IPM Components
Working With Source Devices
Viewing Source Properties
Viewing a List of Configured Source Devices
Source Properties window -1 appears
Deleting Source Devices
Working With Target Devices
Adding a New Source Device
Confirmation box appears
Viewing Target Properties
Viewing a List of Defined Targets
Target Properties window -2 appears
Deleting Targets
Adding a New Target
Selected targets are deleted from the IPM database
Working With Operations
Viewing a List of Defined Operations
Operation Configuration Window
Viewing Operation Properties
Operation Properties window -4 appears
Setting Thresholds and Generating Alerts
Adding a New Operation
OL-11291-01
Deleting Operations
Working With Collectors
Selected operations are deleted from the IPM database
Viewing a List of Defined Collectors
Viewing a Collector State Summary
Viewing Collector Properties
Collector State Summary Window
Adding a New Collector
Collector Properties Window
Deleting Collectors
Stopping Collectors
Selected collectors are deleted from the IPM Main Window
Platform File Name Default Seed File Directory
Adding Components Using Seed Files
Creating a Seed File
1describes the parts of a component’s definition
Part Description
Sample Source Seed File
Sample source seed file is shown below
Sample target seed file is shown below
Sample collector seed file is shown below
Target1 DefaultIpEcho 12 M
Loading Components From a Seed File
Viewing Seed File Output Files
Changing IP Addresses
Setting the Baseline
Change IP Address Window
Setting IPM Database Preferences
Edit Baseline Window
Changing the Database Preferences
Displaying the Current Database Preferences
Windows, enter
Modifying IPM Components Setting IPM Database Preferences
Database Preferences File Format
Modifying IPM Components Setting IPM Database Preferences
Setting Snmp Timeout and Retry Environment Variables
Setting Snmp Environment Variables in Solaris
Setting Snmp Environment Variables in Windows
Setting New IPM Server Process Timeout Values
Setting Server Timeout Values in Solaris
Setting Server Timeout Values in Windows
Setting the Display Variable in Solaris
Ipm Ipm control -rt Ipm debug Ipm pmstatus Ipm start client
Nvram Settings
Backing Up or Restoring the IPM Database
Managed Source Interface Settings
Program Files\Internetwork Performance Monitor\
Ipm password
Changing Administrative Password
Changing IPM Database Password
Ipm dbpassword
Message Log Window -10 appears
Working With Message Log Window
Log Control
Message Log window is composed of the following sections
Field Description
Reset Apply Exit Help
Log Display
Buttons
Button Description
Accessing IPM Data From the CiscoWorks Homepage
Working With IPM From the CiscoWorks Homepage
Viewing IPM Server Information
CiscoWorks Homepage
Viewing Status Information for IPM Servers
Server Status
Viewing the IPM Server Log
Server Log File page -4 appears
Viewing the IPM Console Log
Console Log page -5 appears
Viewing the Troubleshooting Log for IPM
Console Log File
Importing Devices From Device and Credential Repository
Import from Device and Credential Repository screen appears
Import From Device and Credential Repository
Invalid device. Check whether the device exists and has SAA
1describes the response codes
Success. The device has been imported successfully
Invalid host name. Provide a valid host name for the device
IPM Client for Solaris page -8 appears
Downloading the IPM Client
Downloading the IPM Client for Solaris
Downloaded
# rm -rftempdirectory
Downloading the IPM Client for Windows
IPM Client for Windows page -9 appears
OL-11291-01
Viewing Configuration Information
Viewing Source Configuration Information
Viewing Target Configuration Information
Viewing Operation Configuration Information
Viewing Collector Configuration Information
12 Operations Configuration Report
13 Collectors Configuration Report
Viewing Path Echo Collector Path Usage Data
Viewing Latency Data
Viewing Daily Latency Data
15 Daily Latency Reports
16 Daily IP-Echo Latency Summary Report
18 Daily IP-Path Latency Summary Report
Viewing Weekly Latency Data
Weekly Latency Reports page -20 appears
Viewing Monthly Latency Data
Monthly Latency Reports page -21 appears
Viewing Daily Jitter Data
Viewing Jitter Data
Daily Jitter Reports page -22 appears
22 Daily Jitter Reports
Viewing Weekly Jitter Data
Weekly Jitter Reports page -24 appears
Viewing Monthly Jitter Data
Monthly Jitter Reports page -25 appears
Viewing Daily Http Data
Viewing Http Data
Daily Http Reports page -26 appears
Viewing Weekly Http Data
27 Daily Http Summary Report
Viewing Monthly Http Data
28 Weekly Http Reports
Accessing Software Updates and Additional Information
Viewing Information About IPM on Cisco.com
IPM FAQs and Troubleshooting Tips
IPM FAQs
Appendix a IPM FAQs and Troubleshooting Tips
For ksh, enter
Export CLASSPATH=
Export Npxpluginpath
Cisco IOS SA Agent Maximum Number Feature Set
Collectors
Appendix a IPM FAQs and Troubleshooting Tips
Appendix a IPM FAQs and Troubleshooting Tips
FTP
Appendix a IPM FAQs and Troubleshooting Tips
Active Mode
Passive Mode
Troubleshooting IPM
Connection to server Lost. Will try to reconnect
OL-11291-01
User Guide for Internetwork Performance Monitor
OL-11291-01
If you see this message, the Responder is disabled
HostName=IP Address
OL-11291-01
Command Description
SrcName
Options
RtcollName srcName
StartcollName srcName duration hrs
Restores the IPM database from a previous backup
Replaces the IPM Database with a clean version
Controls Automatic IPM Database backup
Takes a back up of the IPM database
System that has multiple IP addresses or host names
Displays the contents of the IPM-IOS-Info file
Target, the cause might be one of the following
Changes an old IP address to a new IP address
You can use this command only on a Solaris machine
Allows you to change existing IPM administrative passwords
Displays the contents of the Readme file for IPM
Loads the specified source seed file into the IPM database
Hostname filename type
Hostname
Displays the contents of the specified source seed file
Starts the IPM Remote Upgrade Utility
Displays the contents of the specified collector seed file
Displays the contents of the specified target seed file
Output of ipm status Command
Output of ipm help Command
Windows
Seed file format of all components
Output of ipm export help Command
Cs CollectorName
User Guide for Internetwork Performance Monitor
IPM Internal Commands
Ipm cw2ksetup install Ipm cw2ksetup uninstall
OL-11291-01
SA Agent Feature Mapping
On your device run the command
Expected output on your device is
See community string
GL-1
Target device
GL-2
Host address
See host number
GL-3
See duration
GL-4
GL-5
See SA Agent
GL-6
See SRB
IPM-related functions
GL-7
GL-8
SSP
See TCP/IP
GL-9
See WWW
See Vtam
Functions. See also LU
GL-10
D E
IN-1
IN-2
IN-3
Dhcp
IN-4
Http
IN-5
IP Precedence TCP operations
IP Precedence FTP operations
IP Precedence Http operations
IP Precedence UDP operations
IN-7
IN-8
For UDP, enhanced for VoIP
IN-9
IN-10
IN-11
IN-12