CarChip Online Help Printable Version
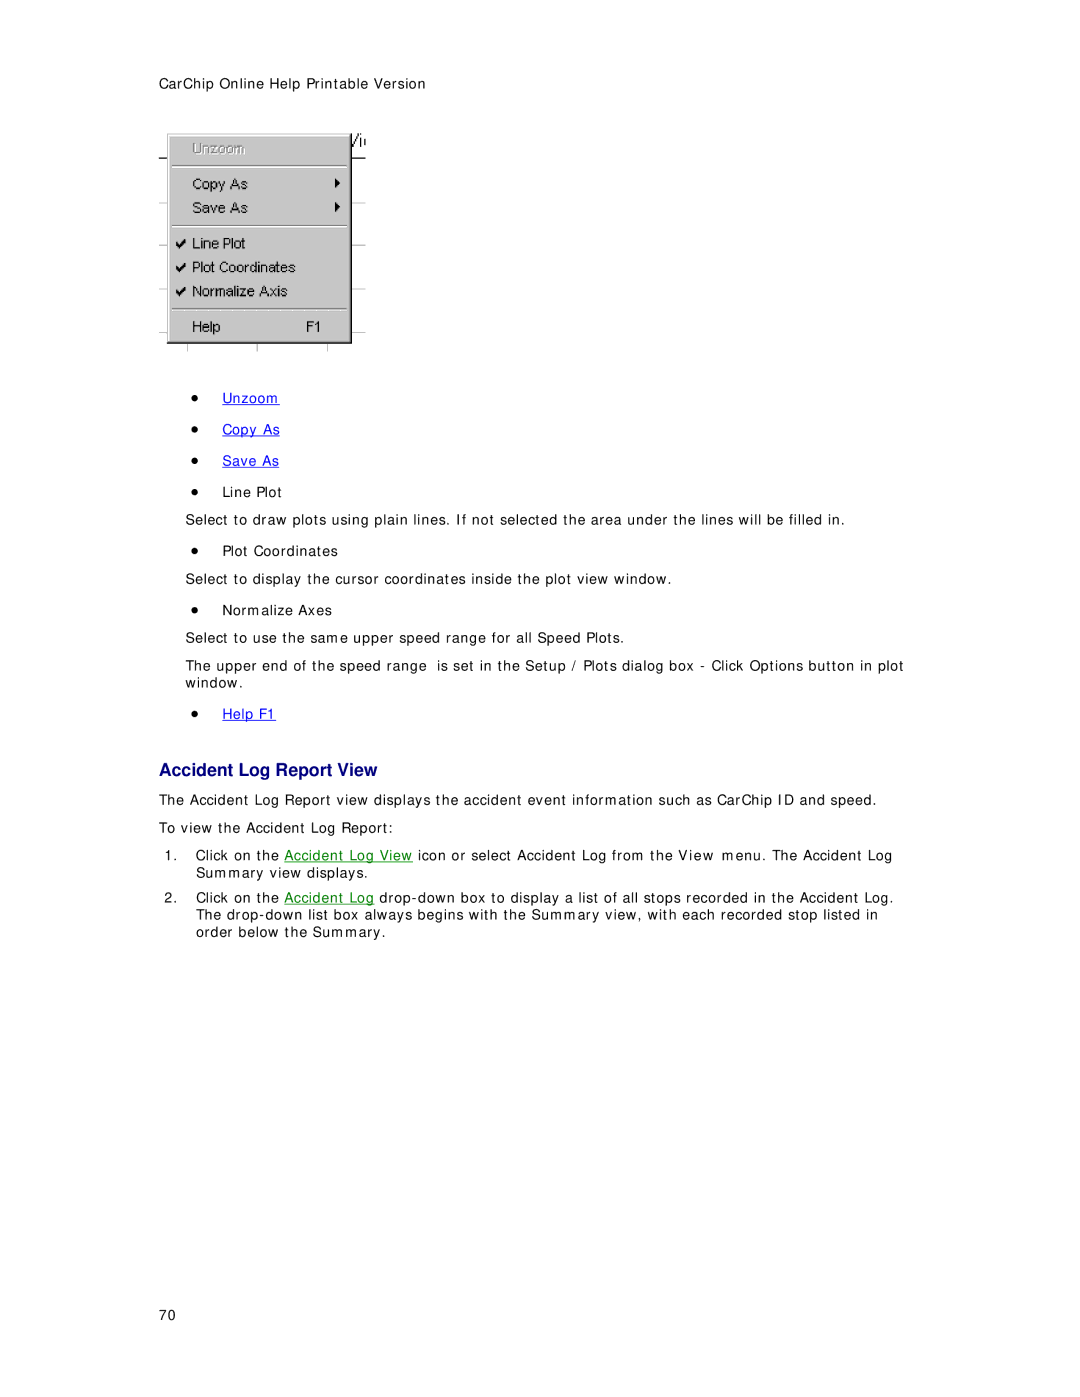
•Unzoom
•Copy As
•Save As
•Line Plot
Select to draw plots using plain lines. If not selected the area under the lines will be filled in.
•Plot Coordinates
Select to display the cursor coordinates inside the plot view window.
•Normalize Axes
Select to use the same upper speed range for all Speed Plots.
The upper end of the speed range is set in the Setup / Plots dialog box - Click Options button in plot window.
•Help F1
Accident Log Report View
The Accident Log Report view displays the accident event information such as CarChip ID and speed. To view the Accident Log Report:
1.Click on the Accident Log View icon or select Accident Log from the View menu. The Accident Log Summary view displays.
2.Click on the Accident Log
70
