Dell PowerVault MD3200 and MD3220 Storage Arrays
May
Contents
Cache Functions and Features
Planning MD3200 Series Storage Array Terms and Concepts
Virtual Disk Operations Limit
Configuring Alert Notifications
Out-of-Band and In-Band Management
Enabling or Disabling the Event Monitor
Managing Host Port Identifiers
Host-to-Virtual Disk Mapping
Configuring Hot Spare Physical Disks
Physical Disk Security with Self Encrypting
Creating a Snapshot Virtual Disk Using
Snapshot Using the Simple Path 137
122
125
145
Re-creating a Snapshot Virtual Disk 152
Creating a Virtual Disk Copy for an Mscs
154
Using DM Multipathing Devices 168
159
160
161
Media Errors and Unreadable Sectors 187
Downloading RAID Controller and Nvsram
177
178
Power Supply/Cooling Fan Module 204
197
202
206
Recovering From an Unresponsive Storage 229
217
Storage Array Support Data 220
221
Safety First-For you and Your Array
Troubleshooting Storage Array Startup Failure
Troubleshooting Loss of Communication
Troubleshooting External Connections
253
Introduction
About This Document
Dell PowerVault MD3200 Series Storage Array
Dell PowerVault Modular Disk Storage Manager
Other Information you May Need
Introduction
Planning About Your Storage Array
Overview
Hardware Features
Front-Panel Features and Indicators
Planning About Your Storage Array
Item Indicator, Button, or Icon Description Connector
Back Panel Features and Indicators
Hard-Drive Indicator Patterns
Hard Drive Indicators
Power Supply and Cooling Fan Features
Drive-Status Indicator Pattern Condition
Power Indicator Codes
Power Indicator Codes Item LED Type Icon Description
Planning RAID Controller Modules
RAID Controller Modules
RAID Controller Module Connectors and Features
Function
Item Component Function
Component Function
RAID Controller Module-Additional Features
Battery Backup Unit
System Password Reset
Storage Array Thermal Shutdown
Shutdown Threshold Type
Event Description
Cache Functions and Features
Cache Mirroring
Write-Back Cache
Write-Through Cache
Planning MD3200 Series Storage Array Terms and Concepts
Physical Disks, Virtual Disks, and Disk Groups
Physical Disks
Physical Disk States
Self-Monitoring Analysis and Reporting Technology
Virtual Disks and Disk Groups
RAID Controller Virtual Disk States Description
RAID Levels
Virtual Disk States
RAID Level Usage
RAID
RAID
Segment Size
Virtual Disk Operations
Virtual Disk Initialization
Background Initialization
Cycle Time
Consistency Check
Media Verification
Disk Group Operations
Virtual Disk Operations Limit
RAID Level Migration
Segment Size Migration
Virtual Disk Capacity Expansion
Disk Group Expansion
Disk Group Operations Limit
RAID Background Operations Priority
Disk Group Defragmentation
Virtual Disk Migration and Disk Roaming
Disk Migration
Planning MD3200 Series Storage Array Terms and Concepts
Advanced Features
Disk Roaming
Snapshot Virtual Disks
Host Server-to-Virtual Disk Mapping
Host Types
Snapshot Repository Virtual Disk
Virtual Disk Recovery
Virtual Disk Copy
Source Virtual Disk
Target Virtual Disk
Using Snapshot and Disk Copy Together
Multi-Path Software
Preferred and Alternate Controllers and Paths
Virtual Disk Ownership
Load Balancing
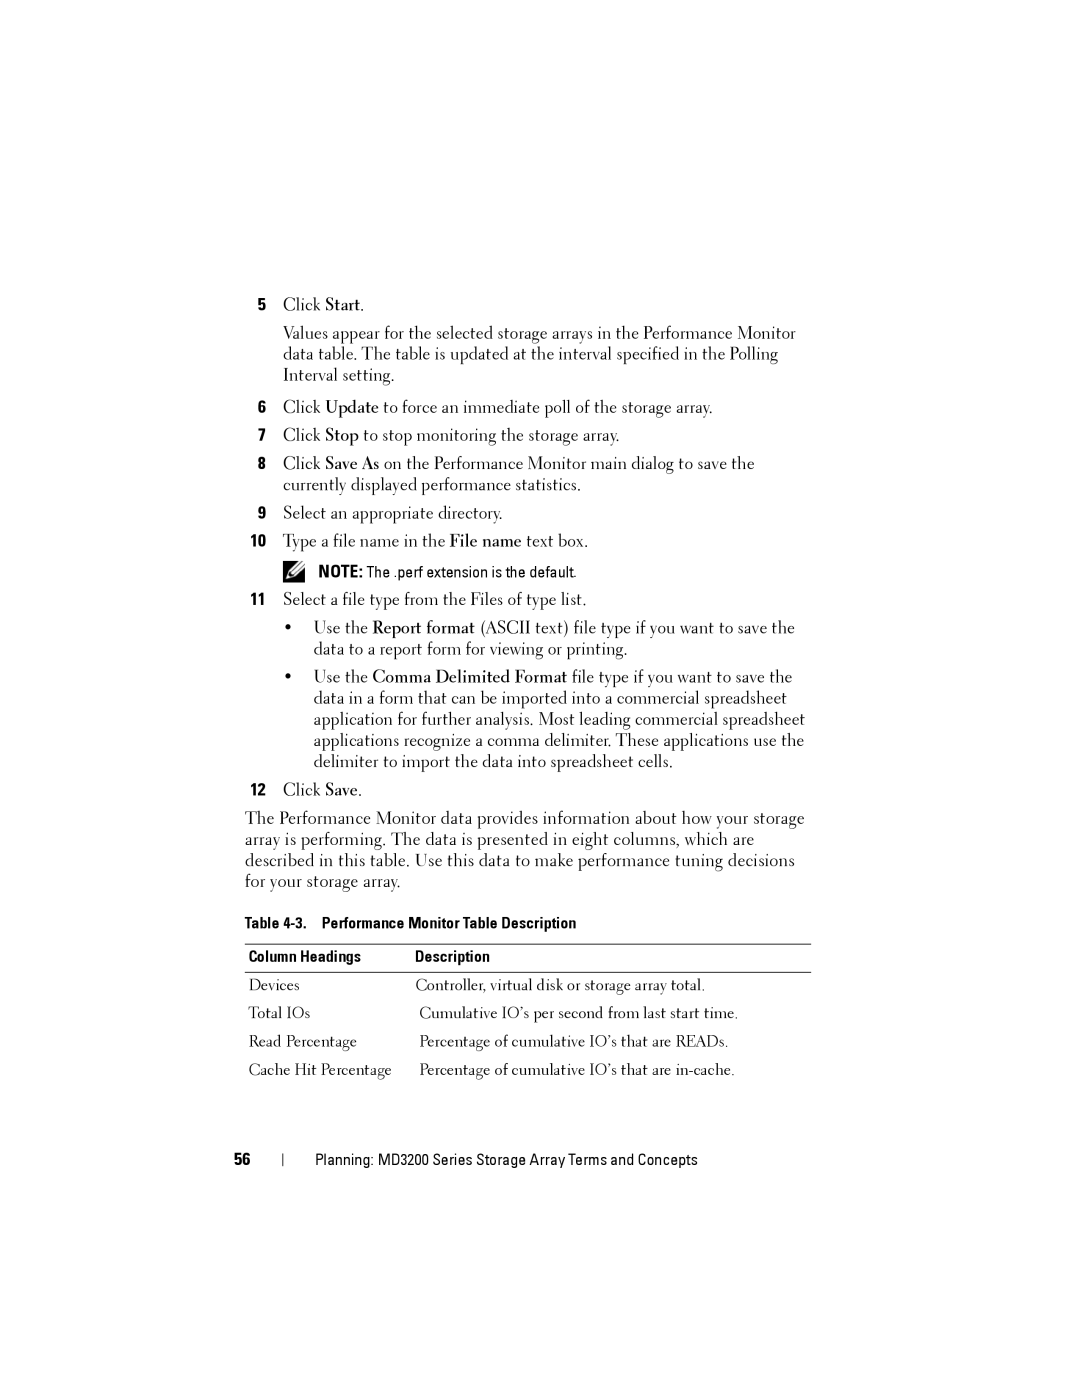
Monitoring MD3200 Series System Performance
Performance Monitor Table Description Column Headings
For more information, see the online help topics
Planning MD3200 Series Storage Array Terms and Concepts
Configuration Overview
User Interface
Enterprise Management Window
Inheriting the System Settings
Select Tools→ Inherit System Settings
Select Inherit system settings for color and font
Array Management Window
Configuration Overview
Out-of-Band Management
Configuration About Your Storage Array
Out-of-Band and In-Band Management
In-Band Management
Storage Arrays
Adding Storage Arrays
Select Edit→ Add Storage Array
Automatic Discovery of Storage Arrays
Manual Addition of a Storage Array
Setting Up Your Storage Array
Locating Storage Arrays
AMW, select Storage Array→ Blink→ Storage Array
Naming or Renaming Storage Arrays
Name/Rename Storage Arrays dialog appears
Type the New password
Setting a Password
Password
Password Guidelines
Viewing Storage Array Connections
Adding/Editing a Comment to an Existing Storage Array
Removing Storage Arrays
Select Edit→ Comment
Select Edit→ Remove→ Storage Array
Enabling Premium Features
Failover Alert Display
Changing the Enclosure Order in the Physical Pane
Changing the Cache Settings on the Storage Array
Changing Expansion Enclosure ID Number
Configuring Alert Notifications
Select Configure Alerts
AMW, select Storage Array→ Change→ Enclosure Order
Select All storage arrays
Configuring E-mail Alerts
Configuration About Your Storage Array
Configuring Snmp Alerts
Battery Settings
Setting the Storage Array RAID Controller Module Clocks
Configuration About Your Storage Array
Configuration Event Monitor
Linux
Enabling or Disabling the Event Monitor
Windows
Configuration About Your Host
Configuring Host Access
Select Mappings→ Define→ Host
Using the Mappings Tab
Defining a Host
Configuration About Your Host
Removing Host Access
Managing Host Groups
Creating a Host Group
Select Mappings→ Remove
Moving a Host to a Different Host Group
Adding a Host to a Host Group
Removing a Host From a Host Group
Select Mappings→ Move
Removing a Host Group
Host Topology
Windows
Starting or Stopping the Host Context Agent
Linux
Data Path Protection
Click Action→ Start
Managing Host Port Identifiers
Add Host Port Identifier dialog appears
Configuration About Your Host
Configuration Disk Groups and Virtual Disks
Creating Disk Groups and Virtual Disks
Creating Disk Groups
Introduction Create Disk Group window is displayed
Configuration Disk Groups and Virtual Disks
Locating a Disk Group
Creating Virtual Disks
Configuration Disk Groups and Virtual Disks
Map later Using Mappings View
Changing the Virtual Disk Modification Priority
Changing the Virtual Disk Cache Settings
100
Changing the Segment Size of a Virtual Disk
101
102
Changing the I/O Type
Select Virtual Disk→ Change→ Segment Size
103
Choosing an Appropriate Physical Disk Type
File system typical Database Multimedia Custom
Physical Disk Security with Self Encrypting Disk
104
105
Creating a Security Key
106
Click Create Key
107
108
Changing a Security Key
Confirm Change Security Key window is displayed
109
Saving a Security Key
Click Change Key
Unlocking Secure Physical Disks
110
111
Configuring Hot Spare Physical Disks
Erasing Secure Physical Disks
112
Select Physical disk→ Hot Spare Coverage
Hot Spare Physical Disk Options window is displayed
Hot Spares and Rebuild
Global Hot Spares
Click Unassign
113
114
Hot Spare Operation
Hot Spare Drive Protection
Criteria for Enclosure Loss Protection RAID Level
Enclosure Loss Protection
115
Host-to-Virtual Disk Mapping
116
Creating Host-to-Virtual Disk Mappings
117
Modifying and Removing Host-to-Virtual Disk Mapping
118
Changing Controller Ownership of the Virtual Disk
119
120
Removing Host-to-Virtual Disk Mapping
Select Virtual Disk→ Change→ Ownership/Preferred Path
Select Disk Group→ Change→ Ownership/Preferred Path
121
Restricted Mappings
Changing the RAID Level of a Disk Group
Select Disk Group→ Change→ RAID Level
122
123
124
Changing the RAID Level of a Disk Group
125
Storage Partitioning
126
127
128
Disk Group and Virtual Disk Expansion
Select Disk Group→ Add Free Capacity Physical Disks
Using Free Capacity
Using Unconfigured Capacity
Virtual Disk Expansion
129
Disk Group Migration
Export Disk Group
Exporting a Disk Group
Non-Exportable Components
131
Import Disk Group
Importing a Disk Group
132
Storage Array Media Scan
Non-Importable Components
Changing Media Scan Settings
133
Suspending the Media Scan
134
Configuration Premium Feature- Snapshot Virtual Disks
135
Creating a Snapshot Virtual Disk Using the Simple Path
136
About the Simple Path
137
138
139
140
Creating a Snapshot Virtual Disk Using the Advanced Path
About the Advanced Path
141
142
Creating the Snapshot Using the Advanced Path
143
Specify Virtual Disk Parameters window is displayed
144
Specifying Snapshot Virtual Disk Names
145
Snapshot Repository Capacity
146
147
148
Click Add Physical Disks
Add Physical Disks window closes
149
Re-creating Snapshot Virtual Disks
Select Virtual Disk→ Snapshot→ Re-create
Disabling a Snapshot Virtual Disk
150
Preparing Host Servers to Re-create a Snapshot Virtual Disk
151
152
Re-creating a Snapshot Virtual Disk
Select Virtual Disk → Snapshot→ Re-create
Configuration Premium Feature- Virtual Disk Copy
153
Creating a Virtual Disk Copy for an Mscs Shared Disk
154
155
Virtual Disk Read/Write Permissions
Virtual Disk Copy Restrictions
Creating a Virtual Disk Copy
156
Before you Begin
Virtual Disk Copy and Modification Operations
Create Copy Wizard
157
Preferred RAID Controller Module Ownership
Failed RAID Controller Module
Failed Virtual Disk Copy
158
159
Copy Manager
Copying the Virtual Disk
Storage Array Performance During Virtual Disk Copy
160
Setting Copy Priority
Stopping a Virtual Disk Copy
Select Change→ Copy Priority
161
162
Recopying a Virtual Disk
Preparing Host Servers to Recopy a Virtual Disk
Recopying the Virtual Disk
163
164
Removing Copy Pairs
Select Copy→ Re-Copy
165
166
Configuration Device Mapper Multipath for Linux
167
168
Using DM Multipathing Devices
Prerequisite Steps
169
Device Mapper Configuration Steps
Scan for Newly Added Virtual Disks
170
171
Create a New fdisk Partition on a Multipath Device Node
Add a New Partition to Device Mapper
Create a File System on a Device Mapper Partition
Mount a Device Mapper Partition
Ready for Use
Important Information About Special Partitions
Device Mapper Commands Descriptions
173
Limitations and Known Issues
174
QuestionAnswer
Troubleshooting
175
176
Downloading RAID Controller and Nvsram Packages
177
Downloading Both RAID Controller and Nvsram Firmware
178
Click Transfer
179
Downloading Only Nvsram Firmware
180
181
Select Tools→ Upgrade RAID Controller Module Firmware
Upgrade RAID Controller Module Firmware window appears
182
Downloading Physical Disk Firmware
183
184
AMW, select Advanced→ Maintenance→ Download→ EMM Firmware
Downloading MD1200 Series Expansion Module EMM Firmware
Download Environmental EMM Firmware dialog appears
185
Self-Monitoring Analysis and Reporting Technology Smart
186
Media Errors and Unreadable Sectors
187
188
189
Management Installing Array Components
Recommended Tools
Installing the Front Bezel
Front Bezel Optional
Removing the Front Bezel
190
Safety Models AMT, E03J, and E04J
Hard Drives
Removing a Drive Blank
191
192
Installing a Drive Blank
Removing a Hard Drive
Removing and Installing a Hard Drive
193
Installing a Hard Drive
194
Removing a Hard Drive From a Hard-Drive Carrier
195
196
Installing a Hard Drive Into a Drive Carrier
RAID Controller Module
Removing a RAID Controller Module Blank
197
Installing a RAID Controller Module Blank
198
Removing a RAID Controller Module
199
200
Installing a RAID Controller Module
Opening the RAID Controller Module
Closing the RAID Controller Module
201
202
RAID Controller Module Backup Battery Unit
Removing the RAID Controller Module Backup Battery Unit
Installing the RAID Controller Module Backup Battery Unit
203
204
Power Supply/Cooling Fan Module
Removing a Power Supply/Cooling Fan Module
Installing a Power Supply/Cooling Fan Module
205
206
Control Panel
Removing the Control Panel
207
Installing the Control Panel
208
209
Backplane
Removing the Backplane
210
16. Removing and Installing the Backplane-PowerVault MD3200
17. Removing and Installing the Backplane-PowerVault MD3220
Installing the Backplane
212
213
Management Firmware Inventory
Viewing the Firmware Inventory
214
Microsoft Services
Virtual Disk Service
Volume Shadow-Copy Service
Management System Interfaces
216
Troubleshooting Your Storage Array Software
Start-Up Routine
Device Health Conditions
217
Status Icon Description
On the Setup tab, select Manage a Storage Array
218
219
Additional Status Icons Description
Storage Array Support Data
220
221
Automatically Collect the Support Bundle Data
Enter the Execution summary
222
Collecting the Physical Disk Data
Event Log
Recovery Guru
223
224
Storage Array Profile
Select Storage Array→ View→ Profile
225
226
Viewing the Logical Associations
Viewing the Physical Associations
Finding Nodes
227
Using Go To
Select Find all free capacity nodes
Click Find Next
228
Recovering From an Unresponsive Storage Array Condition
229
230
231
Locating a Physical Disk
232
233
Locating an Expansion Enclosure
Select Physical Disk→ Blink→ Expansion Enclosure
Capturing the State Information
234
SMrepassist Utility
235
236
Recovering From an Unidentified Storage Array
Unidentified Devices
237
238
Starting or Restarting the Host Context Agent Software
239
240
Troubleshooting Your Array
Troubleshooting Loss of Communication
Troubleshooting External Connections
241
Troubleshooting Power Supply/Cooling Fan Module
242
243
Troubleshooting Array Cooling Problems
Troubleshooting Expansion Enclosure Management Modules
Troubleshooting RAID Controller Modules
244
245
Troubleshooting Hard Drives
246
Troubleshooting Array and Expansion Enclosure Connections
247
Troubleshooting a Wet Storage Array
248
249
Troubleshooting a Damaged Array
Conditions
ECC Errors
PCI Errors
Invalid Storage Array
Critical Conditions
Noncritical Conditions
251
252
Getting Help
Contacting Dell
Visit support.dell.com
Click All Support from Support menu
254
Index
255
256
257
258
259
260