Spectrum measurement
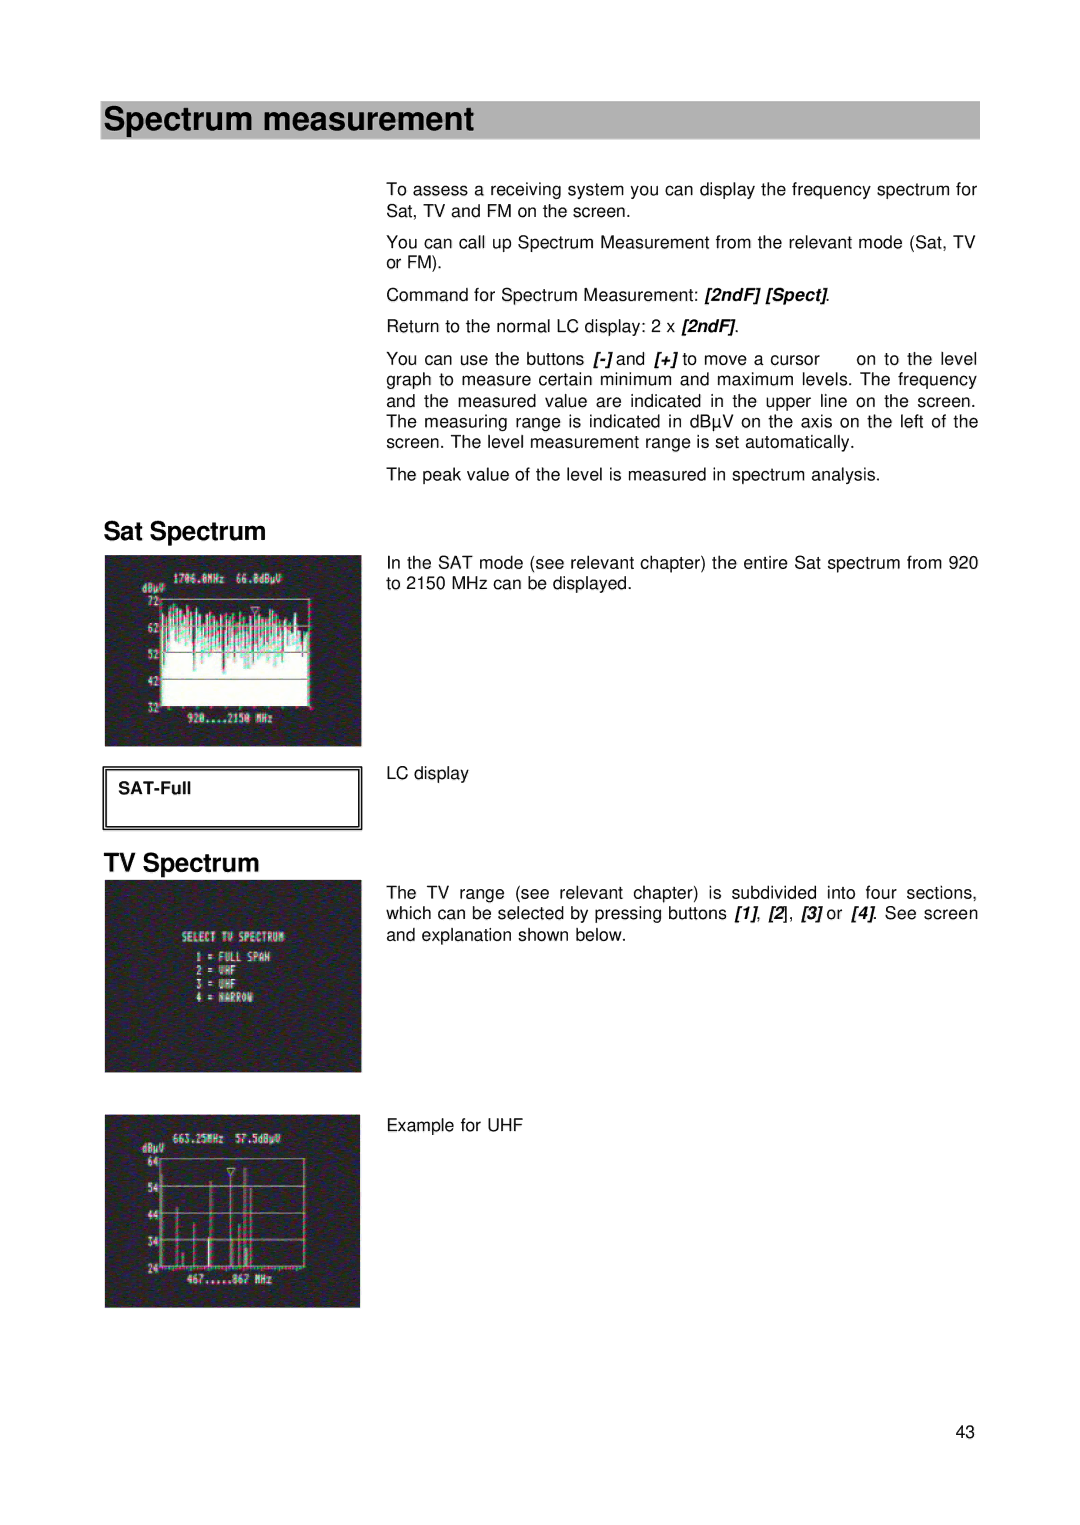
Sat Spectrum
SAT-Full
TV Spectrum
To assess a receiving system you can display the frequency spectrum for Sat, TV and FM on the screen.
You can call up Spectrum Measurement from the relevant mode (Sat, TV or FM).
Command for Spectrum Measurement: [2ndF] [Spect].
Return to the normal LC display: 2 x [2ndF].
You can use the buttons
The peak value of the level is measured in spectrum analysis.
In the SAT mode (see relevant chapter) the entire Sat spectrum from 920 to 2150 MHz can be displayed.
LC display
The TV range (see relevant chapter) is subdivided into four sections, which can be selected by pressing buttons [1], [2], [3] or [4]. See screen and explanation shown below.
Example for UHF
43