Monitor List
All the Web Smart Device in the Monitor List can be monitored; you can also receive the trap and show the status of the device.
The following fields are included in the Monitor List:
Symbol | : | An “S” indicates a system device that is currently being |
|
| monitored. |
|
| An “X” indicates a device that is not currently connected. |
IP Address | : | Shows the current IP address of the device. |
MAC Address : | Shows the device MAC Address. | |
Protocol version: | Shows the version of the Utility protocol. | |
Product Name : | Shows the device product name. | |
System Name | : | Shows the appointed device system name. |
Location | : | Shows where the device is located. |
Trap IP | : | Shows the IP where the Trap is to be sent. |
Subnet Mask | : | Shows the Subnet Mask set of the device. |
Gateway | : | Shows the Gateway set of the device. |
View Trap | : | The Trap function can receive the events that happen |
|
| from the Web Management Switch in the Monitor List. |
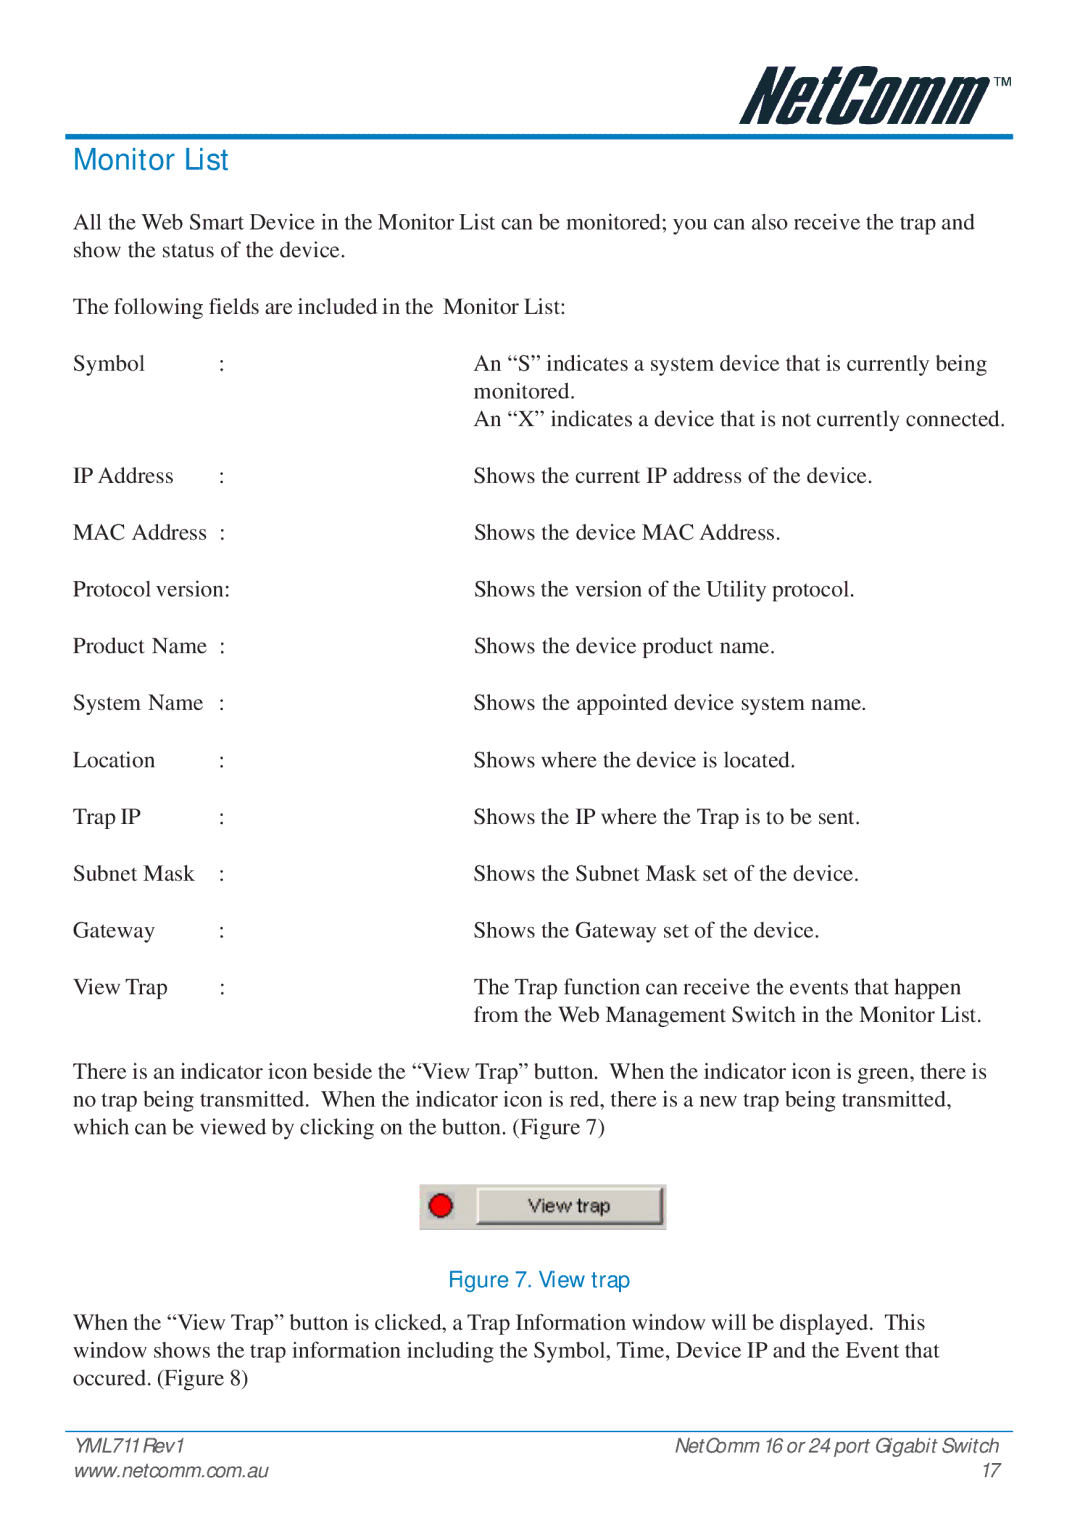
There is an indicator icon beside the “View Trap” button. When the indicator icon is green, there is no trap being transmitted. When the indicator icon is red, there is a new trap being transmitted, which can be viewed by clicking on the button. (Figure 7)
Figure 7. View trap
When the “View Trap” button is clicked, a Trap Information window will be displayed. This window shows the trap information including the Symbol, Time, Device IP and the Event that occured. (Figure 8)
YML711 Rev1 | NetComm 16 or 24 port Gigabit Switch |
www.netcomm.com.au | 17 |
