NETGEAR, Inc
Bestätigung des Herstellers/Importeurs
Trademarks
Statement of Conditions
EU Regulatory Compliance Statement
Additional Copyrights
Voluntary Control Council for Interference Vcci Statement
MD5
Zlib
Product and Publication Details
V1.1, March
Contents
Chapter Performing System Management Tasks
Chapter Monitoring System Performance
Page
Conventions, Formats, and Scope
About This Manual
Manual Part Publication Version Description Number Date
Revision History
Chapter Introduction
About Stream Scanning
Key Features and Capabilities
What Can You Do with an STM150?
Front Panel Features
Service Registration Card with License Keys
Rear Panel Features
Choosing a Location for the STM150
Default IP Address, Login Name, and Password Location
Using the Rack Mounting Kit
V1.1, March
Choosing a Deployment Scenario
Provisioning Threat Management Services
Gateway Deployment
Server Group
Segmented LAN Deployment
Use the Installation Guide to Perform Initial Configuration
Logging In to the STM150
V1.1, March
Click Register
Registering the STM150
Web Security
Use the Setup Wizard to Complete the Configuration
Setup Wizard Options
Email Security
Web Categories
Verifying the STM150 Installation
Update Settings
Email Notification Server
Testing Http Scanning
Testing Connectivity
What to Do Next
Configuring Network Settings
Modifying System Settings
Performing System Management Tasks
V1.1, March
Enabling Session Limits and Timeouts
Scanning Exclusions
On the menu, click Global Settings Scanning Exclusions
To enter a scanning exclusion rule
On the menu, click Administration Time Zone
Setting the System Time
To set the system time
To specify a notification server
Specifying the Notification Server
Customizing Email Alerts
Click Save Changes
To enable system administrator email alerts
To configure the Snmp settings
Configuring Snmp Settings
On the menu, click Administration Snmp
Defining Trusted Snmp Hosts
Supported MIB Browsers
To define Snmp Traps
Backing Up the STM150 Configuration
Backing Up and Restoring Configurations
Restoring a Configuration
To Back Up the STM150 Settings
To restore the STM150 settings
Restarting the STM150
Resetting to Factory Defaults
Enabling Remote Management
Configuring Scheduled Updates
Administering Software Updates
Performing a Manual Update
To configure scheduled updates
On the menu, go to Administration Software Update
Applying a Software Update that Requires a Reboot
Administering Admin Login Timeouts and Passwords
V1.1, March
V1.1, March
Chapter Customizing Scans
Default Scan Settings
Customizing Email Scanning Settings
Email Security Anti-Virus Notification Settings on the menu
End User Email Notification Settings
Insert Warning into Email Subject Line Smtp
Append Safe Stamp Smtp & POP3
Send Warning Email When Malware Is Found
Replace Infected Attachment with Warning Message
Email Content Filtering
Filter by File Type
Filter by Password-protected Attachments
Filter by Subject Keywords
File Extension
Protecting Against Email Spam
Setting Up the Whitelist and Blacklist
Email Security Anti-Spam Whitelist and Blacklist
To define the sender whitelist. On the menu, go to
To define the recipient whitelist. On the menu, go to
Configuring the Real-time Blacklist
To add a new provider
Configuring Distributed Spam Analysis
To configure distributed spam analysis
Customizing Web Scanning Settings
Configuring Web Malware Scans
Configuring Web Content Filtering
V1.1, March
V1.1, March
White List
Configuring Web URL Filtering
Blacklist
Http Tunneling
Https Scan Settings
Https Third Party Website Certificate Handling
STM150 CA Certificate
Show This Message When an SSL Connection Attempt Fails
V1.1, March
Web Security Https Scan Certificate Management
Certificate Management
Trusted Certificate Authorities
To import a new certificate used for Https scans
Untrusted Certificates
Trusted Hosts
To add hosts to the Host Access Control List
Web Security Http and Https Trusted Hosts
To delete hosts from the Host Access Control List
Configuring FTP Scan
Web Security FTP
V1.1, March
Chapter Monitoring System Performance
Viewing the System Status
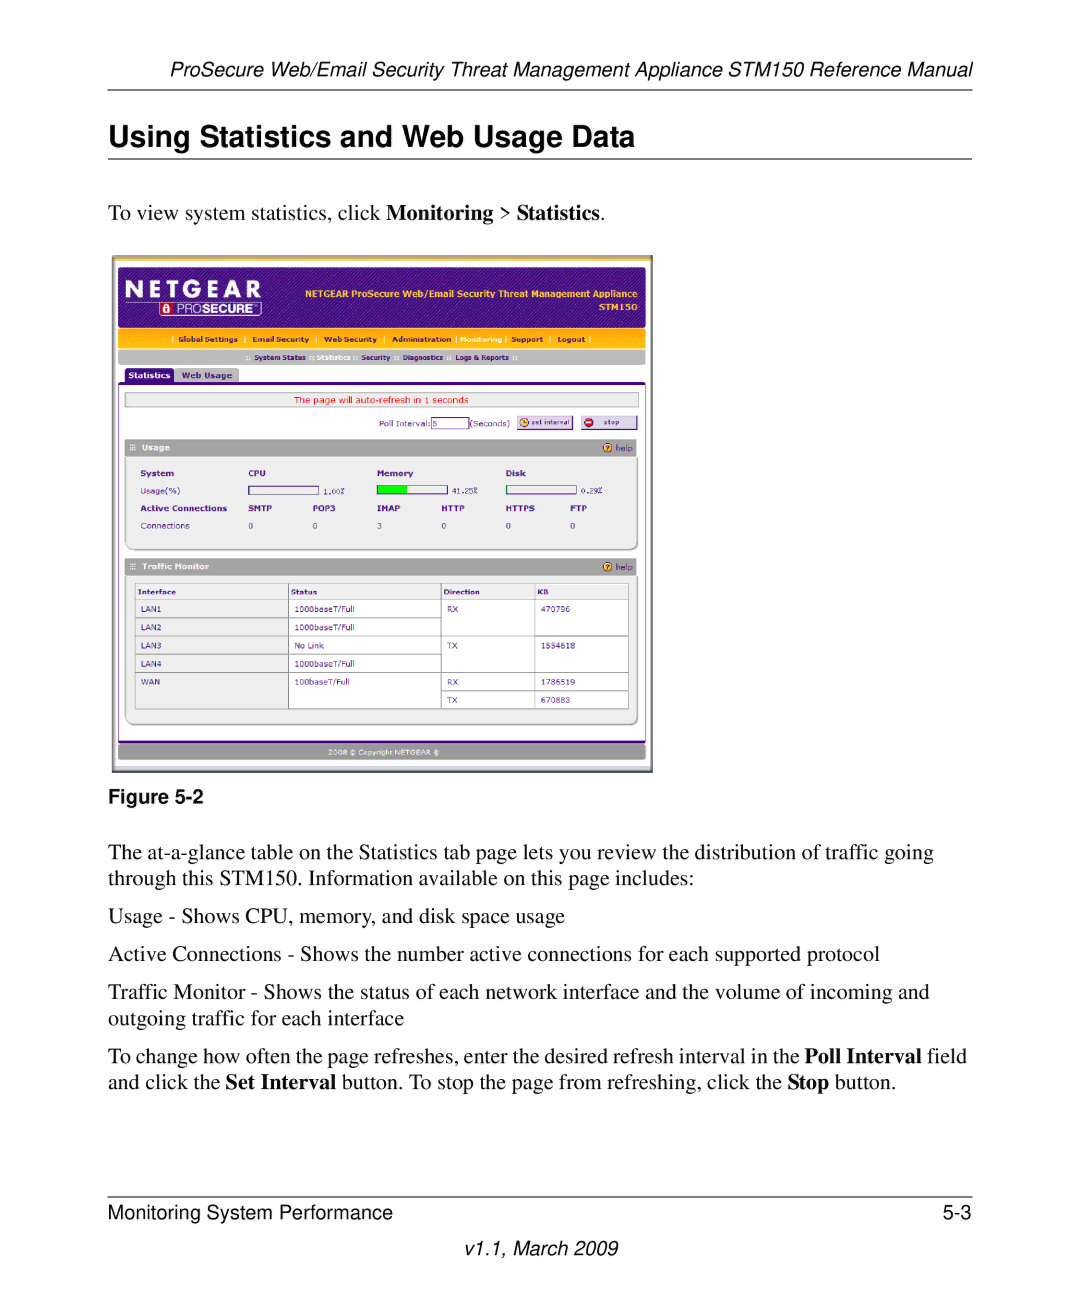
Using Statistics and Web Usage Data
V1.1, March
Monitoring Security
Using the Network Diagnostic Tools
Running Diagnostics
Monitoring Diagnostics
Gathering Important Log Information
Using the Realtime Traffic Diagnostic Tools
To collect information about your STM150
Generate Network Statistics Report
Using Reports to Optimize Protection and Performance
Working with Logs
Sending Logs
Querying Logs
Log Management
Using Logs to Identify Infected Clients
Send Reports by Email
Working with Reports
On the menu, click Logs & Reports Scheduled Report
Enabling Remote Troubleshooting
Using Online Support
Support Online Support
Working with Hot Fixes
To install a hot fix
Go to Support Hot Fixes
On the menu, go to Support Malware Analysis
Sending Suspicious Files to Netgear for Analysis
Table A-1. STM150 Default Configuration Settings
Appendix a Default Settings and Technical Specifications
STM150 specifications are listed in the table below
Document Link
Appendix B Related Documents
V1.1, March
Index N

