Using the Web site
Charting History
Each
Only similar types of sensors are allowed to be charted together. For example, wind readings can be charted together, but not wind and temperature readings.
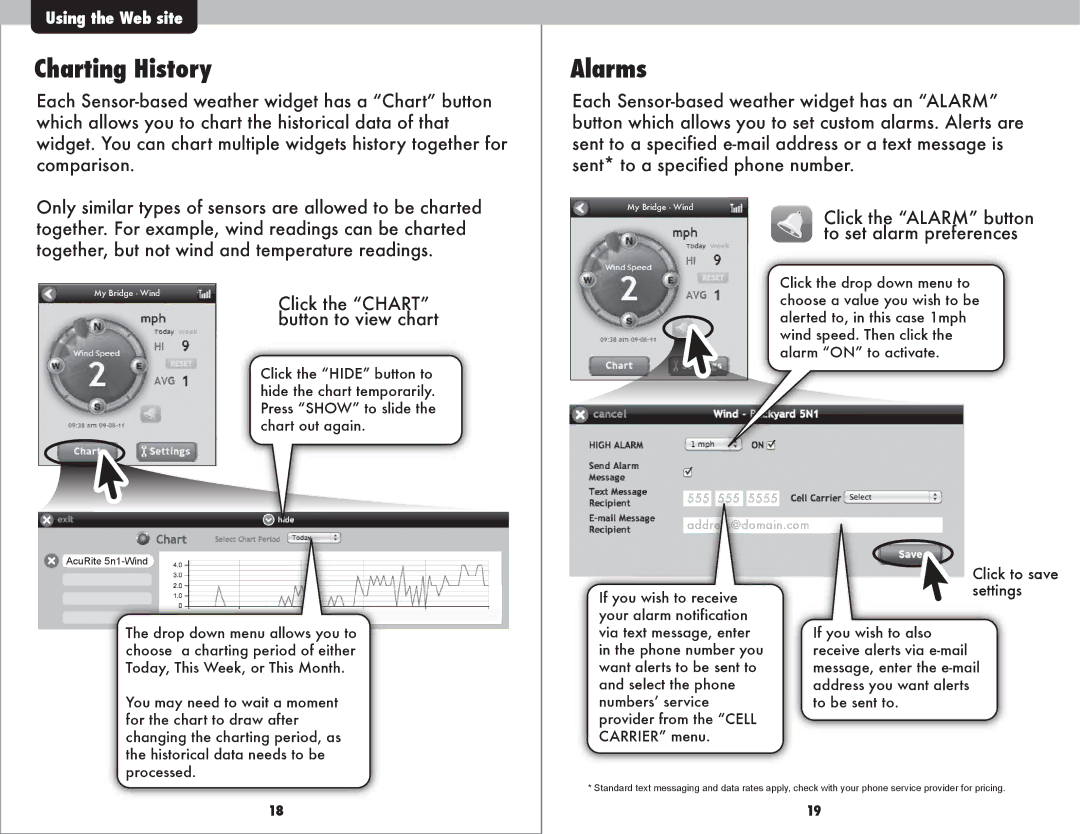
My Bridge - Wind | Click the “CHART” |
| |
| button to view chart |
Click the “HIDE” button to hide the chart temporarily. Press “SHOW” to slide the chart out again.
Alarms
Each
My Bridge - Wind | Click the “ALARM” button |
| |
| to set alarm preferences |
Click the drop down menu to choose a value you wish to be alerted to, in this case 1mph wind speed. Then click the alarm “ON” to activate.
AcuRite
The drop down menu allows you to choose a charting period of either Today, This Week, or This Month.
You may need to wait a moment for the chart to draw after changing the charting period, as the historical data needs to be processed.
555 555 5555
address@domain.com
If you wish to receive your alarm notification via text message, enter in the phone number you want alerts to be sent to and select the phone numbersʼ service provider from the “CELL CARRIER” menu.
Click to save settings
If you wish to also receive alerts via
18
* Standard text messaging and data rates apply, check with your phone service provider for pricing.
19
