Noise Figure Measurement Application

General Specifications

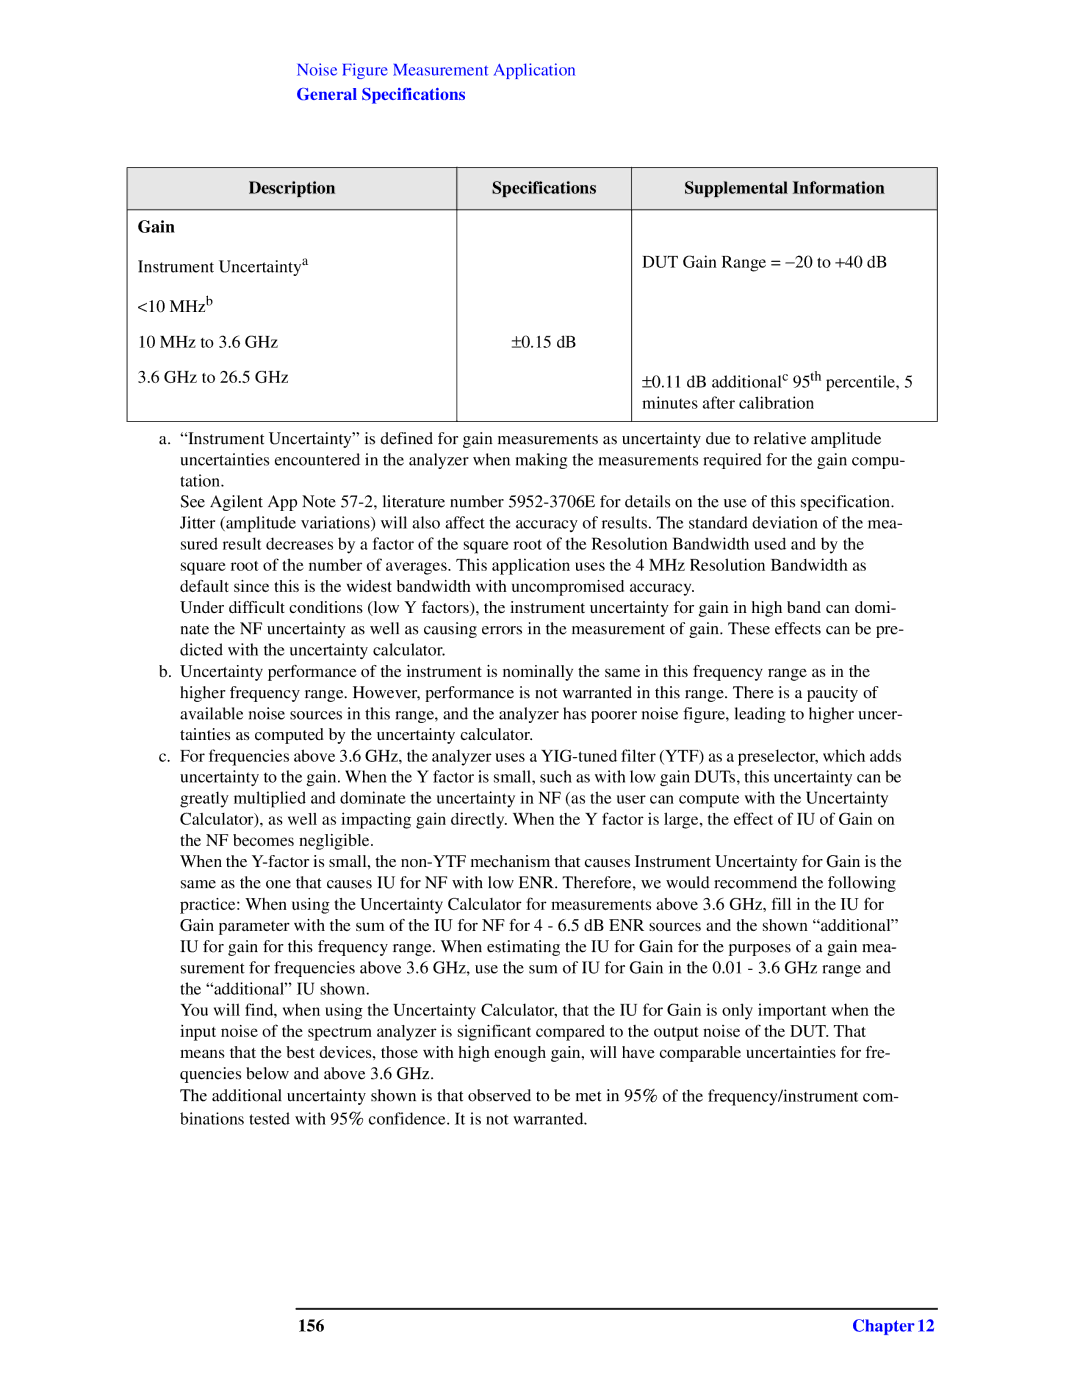
Description

Specifications

Supplemental Information


Gain


Instrument Uncertaintya


DUT Gain Range = 20 to +40 dB

<10 MHzb


10 MHz to 3.6 GHz

±0.15 dB


3.6 GHz to 26.5 GHz


±0.11 dB additionalc 95th percentile, 5


minutes after calibration


a.“Instrument Uncertainty” is defined for gain measurements as uncertainty due to relative amplitude uncertainties encountered in the analyzer when making the measurements required for the gain compu- tation.

See Agilent App Note 57-2, literature number 5952-3706E for details on the use of this specification. Jitter (amplitude variations) will also affect the accuracy of results. The standard deviation of the mea- sured result decreases by a factor of the square root of the Resolution Bandwidth used and by the square root of the number of averages. This application uses the 4 MHz Resolution Bandwidth as default since this is the widest bandwidth with uncompromised accuracy.

Under difficult conditions (low Y factors), the instrument uncertainty for gain in high band can domi- nate the NF uncertainty as well as causing errors in the measurement of gain. These effects can be pre- dicted with the uncertainty calculator.

b.Uncertainty performance of the instrument is nominally the same in this frequency range as in the higher frequency range. However, performance is not warranted in this range. There is a paucity of available noise sources in this range, and the analyzer has poorer noise figure, leading to higher uncer- tainties as computed by the uncertainty calculator.

c.For frequencies above 3.6 GHz, the analyzer uses a YIG-tuned filter (YTF) as a preselector, which adds uncertainty to the gain. When the Y factor is small, such as with low gain DUTs, this uncertainty can be greatly multiplied and dominate the uncertainty in NF (as the user can compute with the Uncertainty Calculator), as well as impacting gain directly. When the Y factor is large, the effect of IU of Gain on the NF becomes negligible.

When the Y-factor is small, the non-YTF mechanism that causes Instrument Uncertainty for Gain is the same as the one that causes IU for NF with low ENR. Therefore, we would recommend the following practice: When using the Uncertainty Calculator for measurements above 3.6 GHz, fill in the IU for Gain parameter with the sum of the IU for NF for 4 - 6.5 dB ENR sources and the shown “additional” IU for gain for this frequency range. When estimating the IU for Gain for the purposes of a gain mea- surement for frequencies above 3.6 GHz, use the sum of IU for Gain in the 0.01 - 3.6 GHz range and the “additional” IU shown.

You will find, when using the Uncertainty Calculator, that the IU for Gain is only important when the input noise of the spectrum analyzer is significant compared to the output noise of the DUT. That means that the best devices, those with high enough gain, will have comparable uncertainties for fre-

quencies below and above 3.6 GHz.

The additional uncertainty shown is that observed to be met in 95% of the frequency/instrument com- binations tested with 95% confidence. It is not warranted.

156

Chapter 12

Page 156
Image 156
Agilent Technologies N9010A specifications Description Specifications Supplemental Information Gain, 156

N9010A specifications

Agilent Technologies, now known as Keysight Technologies, offers a wide range of sophisticated measurement instruments, one of which is the N9010A, a high-performance signal analyzer. The N9010A is a versatile tool designed to meet the needs of engineers and researchers dealing with complex signal generation and analysis.

The N9010A signal analyzer is built on the X-Series signal analysis platform, making it an outstanding choice for various applications, including wireless communication, radar, and electronic warfare. Its main features include an extensive frequency range from 9 kHz to 6 GHz, which provides users with the capability to analyze a diverse array of signals.

One of the defining characteristics of the N9010A is its high dynamic range and sensitivity. The instrument has been engineered to ensure that weak signals can be accurately detected in the presence of strong interfering signals. This quality is crucial for applications such as spectrum monitoring and interference analysis.

Equipped with advanced digital signal processing techniques, the N9010A allows for real-time analysis of complex signals. The analyzer supports various modulation techniques and can perform measurements on frequency, time, and phase to provide a comprehensive view of signal performance. Users can leverage its abilities to analyze a wide range of formats including LTE, Wi-Fi, and many others.

Another significant feature of the N9010A is its flexibility. The instrument includes various software options and measurement applications that can be configured to meet specific testing requirements. This adaptability is essential for engineers who need to stay current with industry developments and evolving technologies.

User-friendliness is also a hallmark of the N9010A. The device features an intuitive interface that simplifies the navigation process, making it easier for users to set up tests and perform analyses with reduced training time.

Additionally, the N9010A can be integrated into a broader test environment, allowing for seamless operation within automated measurement systems. This capability enhances productivity and efficiency in design validation and compliance testing.

In summary, the Agilent Technologies N9010A signal analyzer combines advanced technology, high performance, and user-friendly features. Its ability to handle a wide range of applications makes it an essential tool in the toolbox of modern engineers and researchers working in signal analysis, making it a valuable investment in the pursuit of technological advancements.