Software Version
Cisco ASA Series Firewall Asdm Configuration Guide
Cisco ASA Series Firewall Asdm Configuration Guide
N T E N T S
NAT for VPN
Guidelines and Limitations Default Settings
NAT and Same Security Level Interfaces
Configuring Access Rules
Getting Started with Application Layer Protocol Inspection
Select IM Map
Add/Edit H.323 Match Criterion
SIP Class Map
Select Radius Accounting Map
Cisco Unified Communications Manager Prerequisites ACL Rules
Configuring the TLS Proxy for Encrypted Voice Inspection
Creating the TLS Proxy
TCP Intercept and Limiting Embryonic Connections
Blocks
Monitoring Cloud Web Security Related Documents
IP Audit Policy
Licensing Requirements for the ASA CX Module
Operating Modes
Management Access Host/Networks
Document Objectives
About This Guide
Related Documentation
Convention Indication
Conventions
Bold font
Configuring Service Policies
Page
Information About Service Policies
Configuring a Service Policy
Supported Features
Feature Traffic? See
Feature Directionality
For Through
Accounting only
Feature
Feature Matching Within a Service Policy
Global Direction
ASA IPS ASA CX
Order in Which Multiple Feature Actions are Applied
Incompatibility of Certain Feature Actions
Licensing Requirements for Service Policies
Feature Matching for Multiple Service Policies
Guidelines and Limitations
Default Configuration
Default Settings
Adding a Service Policy Rule for Through Traffic
Task Flows for Configuring Service Policies
Default Traffic Classes
Task Flow for Configuring a Service Policy Rule
Cisco ASA Series Firewall Asdm Configuration Guide
Click Next
Click Match or Do Not Match
Cisco ASA Series Firewall Asdm Configuration Guide
Configuring a Service Policy Rule for Management Traffic
Adding a Service Policy Rule for Management Traffic
Click Match or Do Not Match
Managing the Order of Service Policy Rules
Moving an ACE
Feature Name Releases Feature Information
Feature History for Service Policies
Introduced class-map type management, and inspect
Radius-accounting
Page
Information About Inspection Policy Maps
Default Inspection Policy Maps
Choose Configuration Firewall Objects Class Maps
Choose Configuration Firewall Objects Inspect Maps
Defining Actions in an Inspection Policy Map
Identifying Traffic in an Inspection Class Map
Feature History for Inspection Policy Maps
Where to Go Next
Configuring Network Address Translation
Page
Information About NAT ASA 8.3 and Later
Why Use NAT?
NAT Terminology
NAT Types Overview
NAT Types
Static NAT
Information About Static NAT
Information About Static NAT with Port Address Translation
Information About Static NAT with Port Translation
Static NAT with Identity Port Translation
Static Interface NAT with Port Translation
Information About One-to-Many Static NAT
Information About Other Mapping Scenarios Not Recommended
6shows a typical few-to-many static NAT scenario
Dynamic NAT
209.165.201.10
Information About Dynamic NAT
Dynamic NAT Disadvantages and Advantages
Dynamic PAT
Information About Dynamic PAT
Dynamic PAT Disadvantages and Advantages
Per-Session PAT vs. Multi-Session PAT Version 9.01 and Later
Identity NAT
NAT in Routed and Transparent Mode
NAT in Transparent Mode
NAT in Routed Mode
13 NAT Example Transparent Mode
How NAT is Implemented
NAT and IPv6
Main Differences Between Network Object NAT and Twice NAT
Information About Twice NAT
Information About Network Object NAT
14 Twice NAT with Different Destination Addresses
15 Twice NAT with Different Destination Ports
16 Twice Static NAT with Destination Address Translation
Rule Type Order of Rules within the Section
NAT Rule Order
10.1.2.0
NAT Interfaces
Mapped Addresses and Routing
Routing NAT Packets
18 Proxy ARP Problems with Identity NAT
Determining the Egress Interface
Transparent Mode Routing Requirements for Remote Networks
NAT for VPN
NAT and Remote Access VPN
Src 203.0.113.16070 4. Http request to
Dst
NAT and Site-to-Site VPN
See the following sample NAT configuration for ASA1 Boulder
Subnet 10.2.2.0
NAT and VPN Management Access
25 VPN Management Access
DNS and NAT
Troubleshooting NAT and VPN
Enter show nat detail and show conn all
Repeat show nat detail and show conn all
26 DNS Reply Modification, DNS Server on Outside
192.168.1.10
28 DNS Reply Modification, DNS Server on Host Network
2001DB8D1A5C8E1
30 PTR Modification, DNS Server on Host Network
Information About Network Object NAT
Configuring Network Object NAT ASA 8.3 and Later
Prerequisites for Network Object NAT
Licensing Requirements for Network Object NAT
Additional Guidelines
Configuring Dynamic NAT or Dynamic PAT Using a PAT Pool
Configuring Network Object NAT
Detailed Steps
Check the Add Automatic Translation Rules check box
Configuring Network Object NAT ASA 8.3 and Later
Configuring Dynamic PAT Hide
Configuring Network Object NAT ASA 8.3 and Later
Check the Add Automatic Translation Rules check box
Add NAT to a new or existing network object
Configuring Static NAT or Static NAT-with-Port-Translation
Configuring Network Object NAT ASA 8.3 and Later
Check the Add Automatic Translation Rules check box
Configuring Network Object NAT ASA 8.3 and Later
Configuring Identity NAT
From the Type drop-down list, choose Static
Configuring Network Object NAT ASA 8.3 and Later
Defaults
Configuring Per-Session PAT Rules
Fields
Monitoring Network Object NAT
Configuration Examples for Network Object NAT
Static NAT for an Inside Web Server
Providing Access to an Inside Web Server Static NAT
Cisco ASA Series Firewall Asdm Configuration Guide
Cisco ASA Series Firewall Asdm Configuration Guide
Dynamic NAT for Inside, Static NAT for Outside Web Server
Cisco ASA Series Firewall Asdm Configuration Guide
Cisco ASA Series Firewall Asdm Configuration Guide
Cisco ASA Series Firewall Asdm Configuration Guide
Cisco ASA Series Firewall Asdm Configuration Guide
Static NAT with One-to-Many for an Inside Load Balancer
Cisco ASA Series Firewall Asdm Configuration Guide
Cisco ASA Series Firewall Asdm Configuration Guide
Static NAT-with-Port-Translation
Cisco ASA Series Firewall Asdm Configuration Guide
Cisco ASA Series Firewall Asdm Configuration Guide
Cisco ASA Series Firewall Asdm Configuration Guide
Create a network object for the FTP server address
Cisco ASA Series Firewall Asdm Configuration Guide
DNS Reply Modification Using Outside NAT
Cisco ASA Series Firewall Asdm Configuration Guide
2001DB8D1A5C8E1 IPv6 Net DNS Reply
Cisco ASA Series Firewall Asdm Configuration Guide
Cisco ASA Series Firewall Asdm Configuration Guide
Cisco ASA Series Firewall Asdm Configuration Guide
Cisco ASA Series Firewall Asdm Configuration Guide
Platform Feature Name Releases Feature Information
Feature History for Network Object NAT
No-proxy-arp and route-lookup keywords, to maintain
This feature is not available in 8.51 or
Platform Feature Name Releases Feature Information
Platform Feature Name Releases Feature Information
Platform Feature Name Releases Feature Information
Page
Information About Twice NAT
Configuring Twice NAT ASA 8.3 and Later
Prerequisites for Twice NAT
Licensing Requirements for Twice NAT
IPv6 Guidelines
Configuring Twice NAT
Choose Configuration Firewall NAT Rules, and then click Add
Configuring Twice NAT ASA 8.3 and Later
Source Destination
Source Destination
Configuring Twice NAT ASA 8.3 and Later
Configuring Twice NAT ASA 8.3 and Later
Click OK
To configure dynamic PAT, perform the following steps
Configuring Twice NAT ASA 8.3 and Later
Source Destination
Configuring Twice NAT ASA 8.3 and Later
Source Destination
Configuring Twice NAT ASA 8.3 and Later
To configure static NAT, perform the following steps
Configuring Twice NAT ASA 8.3 and Later
Source Destination
Source Destination
Configuring Twice NAT ASA 8.3 and Later
Configuring Twice NAT ASA 8.3 and Later
To configure identity NAT, perform the following steps
Configuring Twice NAT ASA 8.3 and Later
10.1.2.2
Source Destination
Configuring Twice NAT ASA 8.3 and Later
Monitoring Twice NAT
Configuration Examples for Twice NAT
Twice NAT with Different Destination Addresses
Cisco ASA Series Firewall Asdm Configuration Guide
Cisco ASA Series Firewall Asdm Configuration Guide
Cisco ASA Series Firewall Asdm Configuration Guide
Cisco ASA Series Firewall Asdm Configuration Guide
Cisco ASA Series Firewall Asdm Configuration Guide
Cisco ASA Series Firewall Asdm Configuration Guide
Click Apply
Twice NAT with Different Destination Ports
Cisco ASA Series Firewall Asdm Configuration Guide
Cisco ASA Series Firewall Asdm Configuration Guide
Cisco ASA Series Firewall Asdm Configuration Guide
Cisco ASA Series Firewall Asdm Configuration Guide
Cisco ASA Series Firewall Asdm Configuration Guide
Cisco ASA Series Firewall Asdm Configuration Guide
Cisco ASA Series Firewall Asdm Configuration Guide
Click Apply
Feature History for Twice NAT
This feature is not available in 8.51 or
Platform Feature Name Releases Feature Information
Platform Feature Name Releases Feature Information
Page
NAT Overview
Configuring NAT ASA 8.2 and Earlier
Introduction to NAT
NAT Example Routed Mode
NAT in Transparent Mode
209.165.201.1
NAT Control
NAT Control and Same Security Traffic
Dynamic NAT
NAT Types
Remote Host Attempts to Connect to the Real Address
PAT
Static PAT
Static NAT
Bypassing NAT When NAT Control is Enabled
Policy NAT
Policy NAT with Different Destination Addresses
11 Policy Static NAT with Destination Address Translation
NAT and Same Security Level Interfaces
Mapped Address Guidelines
Order of NAT Rules Used to Match Real Addresses
DNS and NAT
12 DNS Reply Modification
13 DNS Reply Modification Using Outside NAT
Configuring NAT Control
Dynamic NAT Implementation
Using Dynamic NAT
Global Pools on Different Interfaces with the Same Pool ID
Real Addresses and Global Pools Paired Using a Pool ID
Global 1
16 Different NAT IDs
Multiple Addresses in the Same Global Pool
17 NAT and PAT Together
Outside NAT
18 Outside NAT and Inside NAT Combined
Managing Global Pools
19 Dynamic NAT Scenarios
Configuring Dynamic NAT, PAT, or Identity NAT
Configuring NAT ASA 8.2 and Earlier Using Dynamic NAT
20 Dynamic Policy NAT Scenarios
Configuring Dynamic Policy NAT or PAT
Configuring NAT ASA 8.2 and Earlier Using Dynamic NAT
Using Static NAT
Inside
Configuring Static NAT, PAT, or Identity NAT
Use Interface IP Address
Use IP Address
Click OK
22 Static Policy NAT Scenarios
Configuring Static Policy NAT, PAT, or Identity NAT
Use IP Address
Click Action Exempt
Using NAT Exemption
Click Action Do not exempt
Configuring Access Control
Page
Information About Access Rules
Configuring Access Rules
Implicit Permits
General Information About Rules
NAT and Access Rules
Using Remarks
Rule Order
Implicit Deny
Outbound ACL
Transactional-Commit Model
Access Rules for Returning Traffic
Information About Access Rules
Additional Guidelines and Limitations
Information About EtherType Rules
Management Access Rules
Supported EtherTypes and Other Traffic
Traffic Type Protocol or Port
Default Settings
Licensing Requirements for Access Rules
Allowing Mpls
Adding an Access Rule
Configuring Access Rules
Choose Configuration Firewall Access Rules
Adding an EtherType Rule Transparent Mode Only
Configuring Management Access Rules
Prerequisites
Advanced Access Rule Configuration
Access Rule Explosion
Configuring Http Redirect
Check the Enable Object Group Search Algorithm check box
Configuring Transactional Commit Model
Edit HTTP/HTTPS Settings
Feature History for Access Rules
Platform Feature Name Releases Feature Information
Page
AAA Performance
Configuring AAA Rules for Network Access
Licensing Requirements for AAA Rules
Information About Authentication
Configuring Authentication for Network Access
ASA Authentication Prompts
One-Time Authentication
AAA Prompts and Identity Firewall
Deployment Supporting Cut-through Proxy Authentication
Static PAT and Http
AAA Rules as a Backup Authentication Method
Authenticate Do not Authenticate
Configuring Network Access Authentication
Click OK
Enabling Secure Authentication of Web Clients
Authenticating Https Connections with a Virtual Server
Authenticating Directly with the ASA
Authenticating Telnet Connections with a Virtual Server
Choose Configuration Firewall AAA Rules, then click Advanced
Configuring the Authentication Proxy Limit
Configuring TACACS+ Authorization
Configuring Authorization for Network Access
Authorize Do not Authorize
Configuring Radius Authorization
About the Downloadable ACL Feature and Cisco Secure ACS
Configuring Cisco Secure ACS for Downloadable ACLs
Configuring Any Radius Server for Downloadable ACLs
Configuring Accounting for Network Access
Account Do not Account
MAC Exempt No MAC Exempt
Feature History for AAA Rules
Information About Public Servers
Configuring Public Servers
Licensing Requirements for Public Servers
Adding a Public Server that Enables Static NAT with PAT
Adding a Public Server that Enables Static NAT
Editing Settings for a Public Server
Feature History for Public Servers
Configuring Application Inspection
Page
How Inspection Engines Work
Getting Started with Application Layer Protocol Inspection
10-1
10-2
When to Use Application Protocol Inspection
10-3
Failover Guidelines
323 H.225
Default Settings and NAT Limitations
10-4
IP Options
NetBIOS Name
Server over IP
10-5
SQL*Net
Smtp
Sun RPC over
10-6
Choose Configuration Firewall Service Policy Rules
Configuring Application Layer Protocol Inspection
10-7
10-8
DNS Inspection
Configuring Inspection of Basic Internet Protocols
11-1
Information About DNS Inspection
Default Settings for DNS Inspection
General Information About DNS
DNS Inspection Actions
11-3
Choose Configuration Firewall Objects Inspect Maps DNS
11-4
Detailed Steps-Protocol Conformance
11-5
Detailed Steps-Filtering
11-6
Detailed Steps-Inspections
11-7
11-8
11-9
11-10
Header Flag
Class
DNS Type Field Value
11-11
11-12
11-13
Resource Record
11-14
Domain Name
11-15
Click Configure
Configuring DNS Inspection
11-16
FTP Inspection
Using Strict FTP
FTP Inspection Overview
11-17
11-18
Select FTP Map
FTP Class Map
Configuration Global Objects Class Maps FTP
Add/Edit FTP Traffic Class Map
11-19
11-20
Add/Edit FTP Match Criterion
FTP Inspect Map
Configuration Global Objects Inspect Maps FTP
11-21
Add/Edit FTP Policy Map Security Level
File Type Filtering
11-22
11-23
Add/Edit FTP Policy Map Details
11-24
Add/Edit FTP Map
11-25
Verifying and Monitoring FTP Inspection
Http Inspection Overview
Http Inspection
Select Http Map
11-26
Http Class Map
Configuration Global Objects Class Maps Http
Add/Edit Http Traffic Class Map
11-27
11-28
Add/Edit Http Match Criterion
11-29
11-30
11-31
Http Inspect Map
Configuration Global Objects Inspect Maps Http
11-32
Add/Edit Http Policy Map Security Level
URI Filtering
11-33
11-34
Add/Edit Http Policy Map Details
11-35
Add/Edit Http Map
11-36
11-37
11-38
Icmp Inspection
Icmp Error Inspection
Instant Messaging Inspection
11-39
Adding a Class Map for IM Inspection
IM Inspection Overview
11-40
Select IM Map
IP Options Inspection
IP Options Inspection Overview
11-41
11-42
Configuring IP Options Inspection
11-43
Select IP Options Inspect Map
Add/Edit IP Options Inspect Map
IP Options Inspect Map
11-44
IPsec Pass Through Inspection Overview
IPsec Pass Through Inspection
11-45
IPsec Pass Through Inspect Map
Select IPsec-Pass-Thru Map
11-46
Add/Edit IPsec Pass Thru Policy Map Details
Add/Edit IPsec Pass Thru Policy Map Security Level
11-47
Optional Configuring an IPv6 Inspection Policy Map
Default Settings for IPv6 Inspection
IPv6 Inspection
Information about IPv6 Inspection
11-49
Configuring IPv6 Inspection
NetBIOS Inspection Overview
NetBIOS Inspection
Select Netbios Map
11-50
Add/Edit NetBIOS Policy Map
NetBIOS Inspect Map
Configuration Global Objects Inspect Maps NetBIOS
Pptp Inspection
Smtp and Esmtp Inspection Overview
Smtp and Extended Smtp Inspection
11-52
11-53
Select Esmtp Map
Esmtp Inspect Map
Configuration Global Objects Inspect Maps Esmtp
11-54
Add/Edit Esmtp Policy Map Security Level
Mime File Type Filtering
11-55
11-56
Add/Edit Esmtp Policy Map Details
11-57
Add/Edit Esmtp Inspect
11-58
11-59
11-60
Tftp Inspection
11-61
11-62
Ctiqbe Inspection
Configuring Inspection for Voice and Video Protocols
Ctiqbe Inspection Overview
12-1
Limitations and Restrictions
Inspection
12-2
How H.323 Works
Inspection Overview
12-3
12-4
Support in H.245 Messages
Select H.323 Map
Configuration Global Objects Class Maps H.323
Class Map
12-5
Add/Edit H.323 Match Criterion
Add/Edit H.323 Traffic Class Map
12-6
Inspect Map
Configuration Global Objects Inspect Maps H.323
12-7
Add/Edit H.323 Policy Map Security Level
Phone Number Filtering
12-8
12-9
Add/Edit H.323 Policy Map Details
12-10
Add/Edit H.323 Map
Add/Edit HSI Group
12-11
Mgcp Inspection Overview
Mgcp Inspection
12-12
12-13
Using NAT with Mgcp
Select Mgcp Map
Configuration Global Objects Inspect Maps Mgcp
Mgcp Inspect Map
12-14
Add/Edit Mgcp Policy Map
Gateways and Call Agents
12-15
Add/Edit Mgcp Group
Rtsp Inspection
12-16
Rtsp Inspection Overview
Using RealPlayer
12-17
Restrictions and Limitations
Configuration Global Objects Inspect Maps Radius
Select Rtsp Map
Rtsp Inspect Map
Add/Edit Rtsp Policy Map
Configuration Firewall Objects Class Maps Rtsp
Rtsp Class Map
12-19
Add/Edit Rtsp Traffic Class Map
SIP Inspection
12-20
12-21
SIP Inspection Overview
Select SIP Map
SIP Instant Messaging
12-22
SIP Class Map
Configuration Global Objects Class Maps SIP
12-23
Add/Edit SIP Match Criterion
Add/Edit SIP Traffic Class Map
12-24
12-25
SIP Inspect Map
Configuration Global Objects Inspect Maps SIP
12-26
12-27
Add/Edit SIP Policy Map Security Level
12-28
Add/Edit SIP Policy Map Details
12-29
12-30
Add/Edit SIP Inspect
12-31
Sccp Inspection Overview
Skinny Sccp Inspection
12-32
12-33
Supporting Cisco IP Phones
Select Sccp Skinny Map
Configuration Global Objects Inspect Maps Sccp Skinny
Sccp Skinny Inspect Map
12-34
12-35
Message ID Filtering
12-36
Add/Edit Sccp Skinny Policy Map Security Level
12-37
Add/Edit Sccp Skinny Policy Map Details
12-38
Add/Edit Message ID Filter
ILS Inspection
Configuring Inspection of Database Directory Protocols
13-1
13-2
SQL*Net Inspection
Sun RPC Inspection
Configuration Properties Sunrpc Server
Sun RPC Inspection Overview
Sunrpc Server
13-4
Add/Edit Sunrpc Service
Dcerpc Inspection
Configuring Inspection for Management Application Protocols
Dcerpc Overview
14-1
Select Dcerpc Map
Configuration Global Objects Inspect Maps Dcerpc
Dcerpc Inspect Map
14-2
14-3
Add/Edit Dcerpc Policy Map
14-4
GTP Inspection
Select GTP Map
GTP Inspection Overview
14-5
GTP Inspect Map
Configuration Global Objects Inspect Maps GTP
14-6
Add/Edit GTP Policy Map Security Level
Imsi Prefix Filtering
14-7
14-8
Add/Edit GTP Policy Map Details
14-9
Add/Edit GTP Map
14-10
Radius Accounting Inspection
Select Radius Accounting Map
Radius Accounting Inspection Overview
Add Radius Accounting Policy Map
14-11
Radius Inspect Map Host
Radius Inspect Map
14-12
Snmp Inspection
RSH Inspection
Radius Inspect Map Other
14-13
Select Snmp Map
Snmp Inspection Overview
Snmp Inspect Map
Add/Edit Snmp Map
14-15
Xdmcp Inspection
14-16
Configuring Unified Communications
Page
15-1
15-2
15-3
TLS Proxy Applications in Cisco Unified Communications
15-4
Model License Requirement1
15-5
15-6
16-1
Using the Cisco Unified Communication Wizard
16-2
16-3
Licensing Requirements for the Unified Communication Wizard
16-4
16-5
Configuring the Private Network for the Phone Proxy
Click the Generate and Export LDC Certificate button
Configuring Servers for the Phone Proxy
16-6
16-7
Address Default Port Description
16-8
16-9
Configuring the Public IP Phone Network
16-10
16-11
16-12
16-13
16-14
16-15
Certificate,
16-16
16-17
Off-path Deployment
Basic Deployment
16-18
16-19
16-20
16-21
16-22
Exporting an Identity Certificate
Installing a Certificate
16-23
16-24
Click Install Certificate
16-25
Saving the Identity Certificate Request
16-26
16-27
16-28
Information About the Cisco Phone Proxy
Configuring the Cisco Phone Proxy
Phone Proxy Functionality
17-1
TCP/RTP TLS/SRTP
17-2
Cisco Unified Communications Manager
Supported Cisco UCM and IP Phones for the Phone Proxy
Cisco Unified IP Phones
17-3
17-4
Licensing Requirements for the Phone Proxy
17-5
Media Termination Instance Prerequisites
Prerequisites for the Phone Proxy
17-6
DNS Lookup Prerequisites
Certificates from the Cisco UCM
Cisco Unified Communications Manager Prerequisites
ACL Rules
Address Port Protocol Description
NAT and PAT Prerequisites
NAT Prerequisites
PAT Prerequisites
7940 IP Phones Support
Prerequisites for IP Phones on Multiple Interfaces
17-9
Prerequisites for Rate Limiting Tftp Requests
Cisco IP Communicator Prerequisites
17-10
End-User Phone Provisioning
Rate Limiting Configuration Example
Ways to Deploy IP Phones to End Users
17-11
General Guidelines and Limitations
Phone Proxy Guidelines and Limitations
17-12
17-13
Media Termination Address Guidelines and Limitations
Task Flow for Configuring the Phone Proxy
Configuring the Phone Proxy
17-14
17-15
Creating the CTL File
17-16
Adding or Editing a Record Entry in a CTL File
17-17
Creating the Media Termination Instance
17-18
Creating the Phone Proxy Instance
17-19
17-20
Adding or Editing the Tftp Server for a Phone Proxy
Linksys Routers
Configuring Your Router
17-21
Application Start End Protocol IP Address Enabled
Feature History for the Phone Proxy
Checked
17-22
18-1
TLS Proxy Flow Cisco IP Phone Cisco ASA
18-2
18-3
Supported Cisco UCM and IP Phones for the TLS Proxy
18-4
Licensing for the TLS Proxy
18-5
18-6
CTL Provider
18-7
Add/Edit CTL Provider
18-8
Configure TLS Proxy Pane
Adding a TLS Proxy Instance
Add TLS Proxy Instance Wizard Server Configuration
18-9
18-10
Add TLS Proxy Instance Wizard Client Configuration
18-11
18-12
Add TLS Proxy Instance Wizard Other Steps
18-13
Edit TLS Proxy Instance Server Configuration
18-14
Edit TLS Proxy Instance Client Configuration
18-15
Add/Edit TLS Proxy
TLS Proxy
18-16
18-17
18-18
Cisco Mobility Advantage Proxy Functionality
Configuring Cisco Mobility Advantage
19-1
19-2
Mobility Advantage Proxy Deployment Scenarios
MMP/SSL/TLS
19-3
Trust Relationships for Cisco UMA Deployments
Mobility Advantage Proxy Using NAT/PAT
19-4
19-5
19-6
Configuring Cisco Mobility Advantage
Task Flow for Configuring Cisco Mobility Advantage
Feature History for Cisco Mobility Advantage
19-7
19-8
Information About Cisco Unified Presence
Configuring Cisco Unified Presence
20-1
Typical Cisco Unified Presence/LCS Federation Scenario
20-2
SIP/TLS
20-3
20-4
Trust Relationship in the Presence Federation
20-5
Xmpp Federation Deployments
20-6
Configuration Requirements for Xmpp Federation
20-7
Licensing for Cisco Unified Presence
20-8
Configuring Cisco Unified Presence Proxy for SIP Federation
20-9
Feature History for Cisco Unified Presence
20-10
Features of Cisco Intercompany Media Engine Proxy
Configuring Cisco Intercompany Media Engine Proxy
21-1
21-2
How the UC-IME Works with the Pstn and the Internet
21-3
Tickets and Passwords
21-4
Architecture
Call Fallback to the Pstn
21-5
21-6
Basic Deployment
21-7
Off Path Deployment
21-8
Licensing for Cisco Intercompany Media Engine
21-9
21-10
Task Flow for Configuring Cisco Intercompany Media Engine
Configuring Cisco Intercompany Media Engine Proxy
21-11
21-12
Configuring NAT for Cisco Intercompany Media Engine Proxy
21-13
Command Purpose
Command Purpose
Configuring PAT for the Cisco UCM Server
What to Do Next
21-14
21-15
Address of Cisco UCM that you want to translate
21-16
Creating ACLs for Cisco Intercompany Media Engine Proxy
Guidelines
Procedure
21-17
21-18
Creating the Cisco Intercompany Media Engine Proxy
21-19
See Creating the Media Termination Instance
21-20
Show running-config uc-ime command
21-21
Creating Trustpoints and Generating Certificates
21-22
Prerequisites for Installing Certificates
21-23
Certified
21-24
Creating the TLS Proxy
21-25
21-26
ACLs for Cisco Intercompany Media Engine Proxy
21-27
Optional Configuring TLS within the Local Enterprise
21-28
Commands Purpose
Where proxytrustpoint for the client trust-point
Where proxytrustpoint for the server trust-point
21-29
21-30
Optional Configuring Off Path Signaling
21-31
Engine Proxy,
21-32
21-33
21-34
Show uc-ime signaling-sessions
Show uc-ime media-sessions detail
Show uc-ime signaling-sessions statistics
21-35
Show uc-ime mapping-service-sessions statistics
Show uc-ime mapping-service-sessions
Show uc-ime fallback-notification statistics
21-36
21-37
Feature History for Cisco Intercompany Media Engine Proxy
21-38
Configuring Connection Settings and QoS
Page
Information About Connection Settings
Configuring Connection Settings
22-1
Dead Connection Detection DCD
TCP Intercept and Limiting Embryonic Connections
22-2
TCP Normalization
TCP Sequence Randomization
TCP State Bypass
22-3
22-4
Licensing Requirements for Connection Settings
Maximum Concurrent and Embryonic Connection Guidelines
TCP State Bypass Unsupported Features
TCP State Bypass
22-5
Task Flow For Configuring Connection Settings
Configuring Connection Settings
Customizing the TCP Normalizer with a TCP Map
22-6
22-7
22-8
Configuring Connection Settings
22-9
Configuring Global Timeouts
22-10
Introduced set connection advanced-options
Feature History for Connection Settings
Tcp-state-bypass
22-11
22-12
Information About QoS
Configuring QoS
23-1
What is a Token Bucket?
Supported QoS Features
23-2
Information About Priority Queuing
Information About Policing
23-3
Information About Traffic Shaping
How QoS Features Interact
23-4
Dscp and DiffServ Preservation
Licensing Requirements for QoS
Model Guidelines
23-5
23-6
Configuring QoS
23-7
125
23-8
Configuring the Standard Priority Queue for an Interface
23-9
Click Enable priority for this flow
23-10
Click Enforce priority to selected shape traffic
Monitoring QoS
23-11
Viewing QoS Standard Priority Statistics
Viewing QoS Police Statistics
23-12
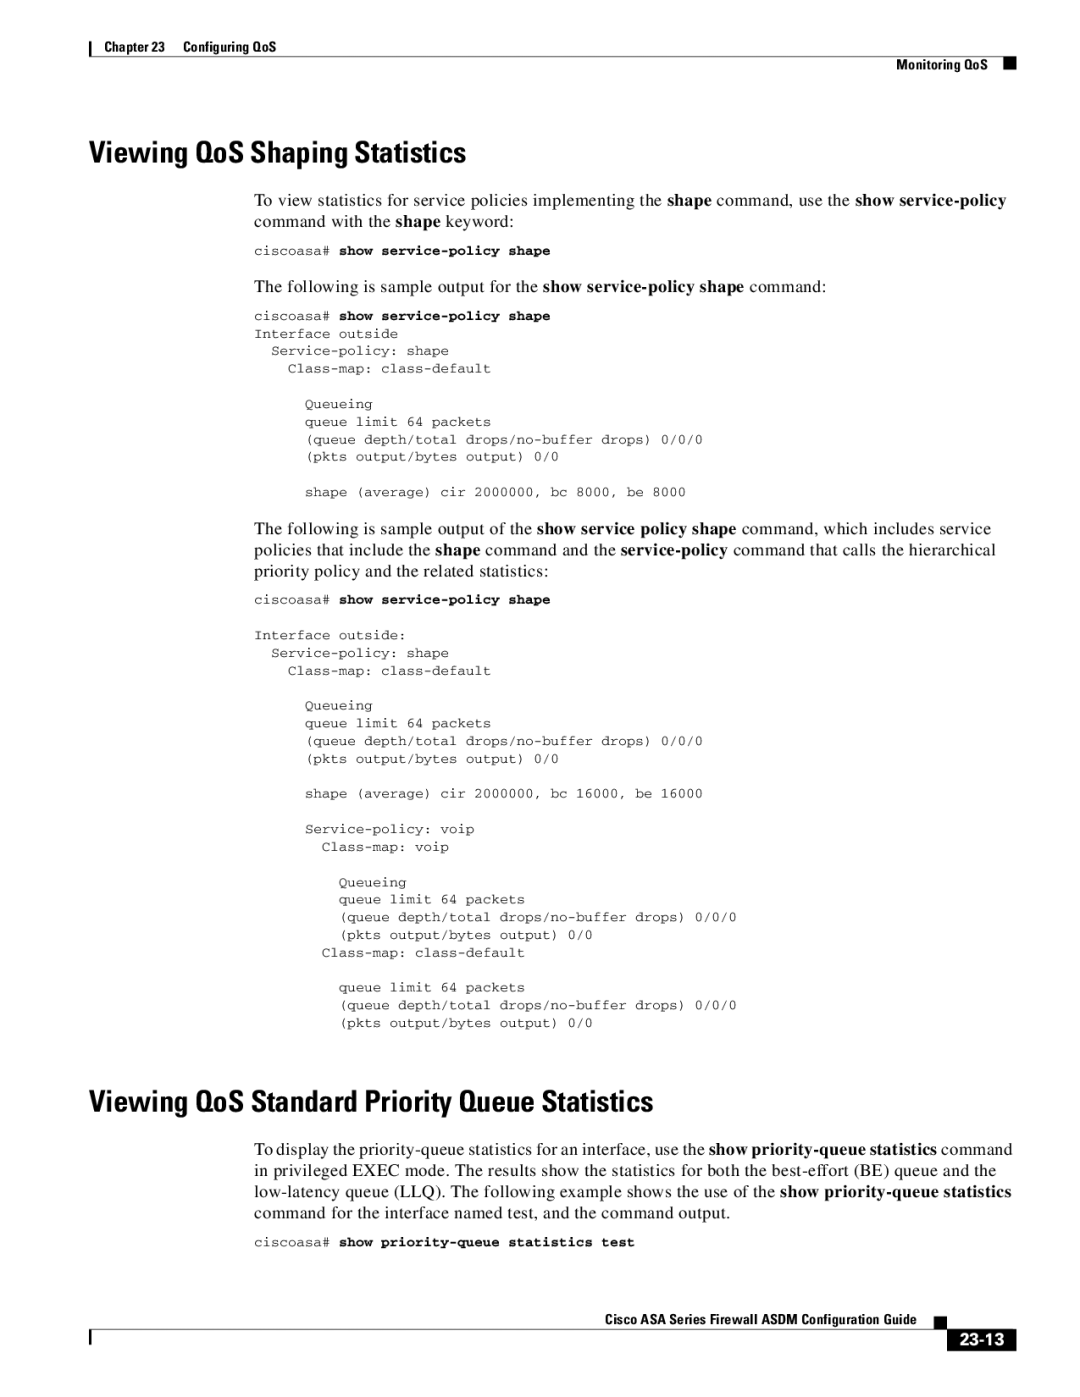
Viewing QoS Standard Priority Queue Statistics
Viewing QoS Shaping Statistics
23-13
23-14
Feature History for QoS
Testing Your Configuration
Troubleshooting Connections and Resources
Pinging ASA Interfaces
24-1
24-2
Network Diagram with Interfaces, Routers, and Hosts
24-3
Information About Ping
Pinging From an ASA Interface
Troubleshooting the Ping Tool
Pinging to an ASA Interface
Pinging Through the ASA Interface
24-5
Using the Ping Tool
Determining Packet Routing with Traceroute
Output Symbol Description
24-6
24-7
Tracing Packets with Packet Tracer
24-8
Monitoring Performance
Blocks
Monitoring System Resources
24-9
24-10
Memory
24-11
Monitoring Connections
24-12
Monitoring Per-Process CPU Usage
Configuring Advanced Network Protection
Page
25-1
Configuring the ASA for Cisco Cloud Web Security
Information About Cisco Cloud Web Security
User Authentication and Cloud Web Security
Redirection of Web Traffic to Cloud Web Security
25-2
Company Authentication Key Group Authentication Key
Authentication Keys
25-3
Directory Groups
ScanCenter Policy
Custom Groups
25-4
Cloud Web Security Actions
How Groups and the Authentication Key Interoperate
25-5
Licensing Requirements for Cisco Cloud Web Security
Failover from Primary to Backup Proxy Server
Bypassing Scanning with Whitelists
IPv4 and IPv6 Support
Prerequisites for Cloud Web Security
Optional User Authentication Prerequisites
Optional Fully Qualified Domain Name Prerequisites
25-7
25-8
Configuring Cisco Cloud Web Security
25-9
Choose Configuration Device Management Cloud Web Security
25-10
25-11
25-12
25-13
25-14
25-15
25-16
25-17
Examples
25-18
25-19
Check Cloud Web Security and click Configure
25-20
25-21
Tcp/http
25-22
25-23
Optional Configuring Whitelisted Traffic
25-24
25-25
Optional Configuring the User Identity Monitor
Monitoring Cloud Web Security
Configuring the Cloud Web Security Policy
25-26
Related Documents
Feature History for Cisco Cloud Web Security
Related Documents
25-27
25-28
Information About the Botnet Traffic Filter
Configuring the Botnet Traffic Filter
26-1
Botnet Traffic Filter Actions for Known Addresses
Botnet Traffic Filter Address Types
Botnet Traffic Filter Databases
Information About the Dynamic Database
26-3
Information About the Static Database
26-4
26-5
How the Botnet Traffic Filter Works
Prerequisites for the Botnet Traffic Filter
Licensing Requirements for the Botnet Traffic Filter
26-6
Task Flow for Configuring the Botnet Traffic Filter
Configuring the Botnet Traffic Filter
26-7
26-8
Configuring the Dynamic Database
Enabling DNS Snooping
Adding Entries to the Static Database
26-9
26-10
26-11
Recommended Configuration
Very Low Moderate High Very High
Blocking Botnet Traffic Manually
26-12
26-13
Searching the Dynamic Database
Botnet Traffic Filter Syslog Messaging
Monitoring the Botnet Traffic Filter
26-14
26-15
Botnet Traffic Filter Monitor Panes
26-16
Feature History for the Botnet Traffic Filter
Information About Threat Detection
Configuring Threat Detection
Licensing Requirements for Threat Detection
27-1
Information About Basic Threat Detection Statistics
Configuring Basic Threat Detection Statistics
27-2
Guidelines and Limitations
Trigger Settings Packet Drop Reason Average Rate Burst Rate
Security Context Guidelines
Types of Traffic Monitored
Monitoring Basic Threat Detection Statistics
Configuring Basic Threat Detection Statistics
Path Purpose
27-4
Feature History for Basic Threat Detection Statistics
Configuring Advanced Threat Detection Statistics
Information About Advanced Threat Detection Statistics
27-5
Choose the Configuration Firewall Threat Detection pane
Configuring Advanced Threat Detection Statistics
27-6
Last 24 hour
Monitoring Advanced Threat Detection Statistics
27-7
Feature History for Advanced Threat Detection Statistics
Configuring Scanning Threat Detection
27-8
27-9
Information About Scanning Threat Detection
Average Rate Burst Rate
Configuring Scanning Threat Detection
27-10
27-11
Feature History for Scanning Threat Detection
27-12
Configuration Firewall Advanced Anti-Spoofing Fields
Using Protection Tools
Preventing IP Spoofing
28-1
Show Fragment
Configuring the Fragment Size
28-2
28-3
Configuring TCP Options
28-4
TCP Reset Settings
Add/Edit IP Audit Policy Configuration
Configuring IP Audit for Basic IPS Support
IP Audit Policy
28-5
IP Audit Signature List
IP Audit Signatures
Signature Message Number Signature Title
28-6
28-7
28-8
Message Number Signature Title
28-9
28-10
28-11
28-12
Information About Web Traffic Filtering
Configuring Filtering Services
29-1
Information About URL Filtering
Filtering URLs and FTP Requests with an External Server
29-2
Guidelines and Limitations for URL Filtering
Licensing Requirements for URL Filtering
Identifying the Filtering Server
29-3
29-4
Configuring Additional URL Filtering Settings
Caching Server Addresses
Buffering the Content Server Response
29-5
Filtering Http URLs
Configuring Filtering Rules
29-6
29-7
29-8
29-9
29-10
29-11
Filtering the Rule Table
Defining Queries
Feature History for URL Filtering
29-12
Configuring Modules
Page
Information About the ASA CX Module
Configuring the ASA CX Module
30-1
30-2
How the ASA CX Module Works with the ASA
Service Policy in Monitor-Only Mode
Monitor-Only Mode
Traffic-Forwarding Interface in Monitor-Only Mode
30-3
Information About ASA CX Management
Initial Configuration
30-4
Compatibility with ASA Features
Information About Authentication Proxy
Policy Configuration and Management
Information About VPN and the ASA CX Module
Prerequisites
Licensing Requirements for the ASA CX Module
30-6
ASA Clustering Guidelines
Monitor-Only Mode Guidelines
30-7
Parameters Default
Configuring the ASA CX Module
Task Flow for the ASA CX Module
30-8
ASA 5585-X Hardware Module
Connecting the ASA CX Management Interface
30-9
If you do not have an inside router
If you have an inside router
30-10
30-11
ASA 5512-X through ASA 5555-X Software Module
30-12
30-13
Example
ASA 5585-X Changing the ASA CX Management IP Address
Multiple Context Mode
30-14
Sets the ASA CX management IP address, mask, and gateway
Single Context Mode
Example
ASDM, choose Wizards Startup Wizard
30-16
Configuring Basic ASA CX Settings at the ASA CX CLI
30-17
30-18
Optional Configuring the Authentication Proxy Port
Redirecting Traffic to the ASA CX Module
Creating the ASA CX Service Policy
30-19
30-20
Click the ASA CX Inspection tab
30-21
Check the Enable ASA CX for this traffic flow check box
Choose Tools Command Line Interface
Configuring Traffic-Forwarding Interfaces Monitor-Only Mode
30-22
Managing the ASA CX Module
Resetting the Password
30-23
30-24
Reloading or Resetting the Module
30-25
Shutting Down the Module
30-26
Monitoring the ASA CX Module
Admin123
30-27
Showing Module Statistics
Showing Module Status
Monitoring Module Connections
Module
Ciscoasa# show asp table classify domain cxsc Input Table
30-29
30-30
Ciscoasa# show asp drop
30-31
Problems with the Authentication Proxy
Troubleshooting the ASA CX Module
Capturing Module Traffic
30-32
30-33
Feature History for the ASA CX Module
30-34
Capture interface asadataplane command
Information About the ASA IPS Module
Configuring the ASA IPS Module
31-1
31-2
How the ASA IPS Module Works with the ASA
Operating Modes
Using Virtual Sensors ASA 5510 and Higher
31-3
31-4
Information About Management Access
31-5
Licensing Requirements for the ASA IPS module
31-6
Vlan
Task Flow for the ASA IPS Module
Configuring the ASA IPS module
31-7
31-8
Connecting the ASA IPS Management Interface
31-9
31-10
ASA
31-11
Sessioning to the Module from the ASA May Be Required
Configuring Basic IPS Module Network Settings
ASA 5512-X through ASA 5555-X Booting the Software Module
31-12
Choose Wizards Startup Wizard
ASA 5510 and Higher Configuring Basic Network Settings
31-13
ASDM, choose Configuration Device Setup SSC Setup
ASA 5505 Configuring Basic Network Settings
31-14
31-15
Configuring the Security Policy on the ASA IPS Module
31-16
Click Continue
31-17
31-18
Diverting Traffic to the ASA IPS module
31-19
Managing the ASA IPS module
31-20
Installing and Booting an Image on the Module
31-21
31-22
Uninstalling a Software Module Image
31-23
31-24
Monitoring the ASA IPS module
31-25
Feature History for the ASA IPS module
31-26
Information About the CSC SSM
Configuring the ASA CSC Module
32-1
32-2
ASA
32-3
Determining What Traffic to Scan
32-4
Common Network Configuration for CSC SSM Scanning
Prerequisites for the CSC SSM
Licensing Requirements for the CSC SSM
32-5
32-6
Parameter Default
Before Configuring the CSC SSM
Configuring the CSC SSM
32-7
32-8
Connecting to the CSC SSM
32-9
Determining Service Policy Rule Actions for CSC Scanning
32-10
CSC SSM Setup Wizard
Activation/License
IP Configuration
32-11
32-12
Host/Notification Settings
Password
Management Access Host/Networks
32-13
Choose Tools CSC Password Reset
Restoring the Default Password
32-14
CSC Setup Wizard Activation Codes Configuration
Wizard Setup
32-15
CSC Setup Wizard Host Configuration
CSC Setup Wizard IP Configuration
32-16
CSC Setup Wizard Password Configuration
CSC Setup Wizard Management Access Configuration
CSC Setup Wizard Traffic Selection for CSC Scan
32-17
32-18
Specifying Traffic for CSC Scanning
32-19
CSC Setup Wizard Summary
Choose Configuration Trend Micro Content Security Web
Using the CSC SSM GUI
Web
32-20
Smtp Tab
Mail
32-21
32-22
File Transfer
32-23
Updates
Monitoring the CSC SSM
Choose Monitoring Trend Micro Content Security Threats
Threats
32-24
Live Security Events Log
Live Security Events
32-25
32-26
Software Updates
Resource Graphs
Troubleshooting the CSC Module
CSC Memory
32-27
Recover command
Installing an Image on the Module
32-28
32-29
Resetting the Password
Shutting Down the Module
Reloading or Resetting the Module
Shuts down the module
32-30
Feature Name Platform Releases Feature Information
Feature History for the CSC SSM
Additional References
Related Topic Document Title
32-32
IN-1
D E
IN-2
FTP Http
IN-3
CSC CPU
IN-4
CSC SSM GUI
IN-5
Application inspection
IN-6
IPS
IN-7
See also class map
IN-8
See Icmp
IN-9
See QoS
IN-10
See PAT
IN-11
URL
IN-12