Model 1724C/1734C
Safety Instructions
Table of Contents
Iii
Plotter Operation
Appendix
AP-10
AP-11
Compliance with R&TTE Directive 1999/5/EC
Features
Vii
Viii
NavNet system Model 1724C/1734C
NavNet system Model 1724C/1734C
Single-unit NavNet system GD-1720C
Single-unit NavNet system GD-1720C
Two-unit NavNet system
Two-unit NavNet system
Three-or-more-unit NavNet system
Xii
Three-or-more-unit NavNet system Max display units
Display unit controls
Operating Controls
Display unit controls
Plotter displays
Soft keys
Display unit
Key Function
Remote controller
Key
Inserting a Chart Card
Turning the Unit On/Off
Display brilliance, panel brilliance
Brilliance adjustment soft keys
Display Brilliance, Panel Brilliance, Hue
Display brilliance and panel brilliance windows
Night Day Twilight
2 Hue
Hue window
Display screens
Selecting a Display
Display modes
Screen type and available display screen
Radar combination screen selection window
Selecting a display
Display screen selection window
Switching control in combination and overlay screens
12 3nm
Radar source and sounder source windows
Selecting image source
Select source menu
Cursor pad, Cursor
Cursor, cursor data
MOB mark messages
Entering the MOB Mark, Setting MOB as Destination
MOB concept
Rearranging data boxes
Data Boxes
Showing, hiding data boxes with soft key
Temporarily erasing a data box
Function keys
Function Default Setting, Key Label
Function Keys
Radar
Simulation setup menu
Simulation Display
Plotter
Sounder
This page intentionally left blank
Radar Display
Radar display
Tuning window
Tuning
Adjusting the Gain
Transmitting, Stand-by
How the A/C SEA works
Adjusting the FTC
Reducing Sea Clutter
Gain sensitivity window
Rain setting window
Adjusting the A/C SEA
SEA setting window
Reducing Precipitation Clutter
Range scales km
Range Scale
Range scales nm, sm
Signal process soft keys
Pulselength
Function Indicator on display Soft key label
Presentation Mode
Selecting a presentation mode
Course-up
Description of presentation modes
Head-up
North-up
Measuring range by range rings
How to measure range to a target with the cursor
Measuring the Range
Measuring range by cursor
Various VRM operations
How to measure range with the VRM
Measuring range by VRM
Measuring bearing by EBL
Measuring the Bearing
Measuring bearing by cursor
Various EBL operations
Erasing the Heading Line, North Marker
Reducing Noise Interference
Rejecting Radar Interference
Radar interference
Zooming ARP, TTM targets
Zoom
Zooming radar targets
Zoom
Automatic shift
Shifting the Picture
Manual shift
Target no. selection window
Predicting collision course
Using the Offset EBL
Setting automatic shift maximum speed
Automatic shift
Measuring range & bearing between two targets
Predicting collision course with the offset EBL
Measuring range and bearing between two targets
Echo Trails
Trail time
Sample echo trails
Trail time window
Starting echo trails
Trail soft keys
Trail color window
Trail gradation
Trail color
Echo Stretch
Types of echo stretch
Echo Averaging
Effect of echo averaging
Outputting TLL Data
Target soft keys
How to set a guard alarm zone
Guard Alarm
Setting a guard alarm zone
Watchman
When the alarm is violated…
Cancelling the guard alarm
How watchman works
Watchman time window
Setting watchman stand-by interval
Turning on/off watchman
Waypoint Marker
Waypoint marker
Usage precautions for ARP
25 ARP, TTM Operation
Acquiring and tracking targets ARP
ARP setup menu
Activating/deactivating ARP, TTM
ARP Target Info window
Automatic acquisition area window
ARP plot symbols
Automatic acquisition
ARP target number
Displaying target number ARP, TTM
Terminating tracking of ARP targets
Terminating tracking of selected targets
Vector reference, vector time
Setting vector attributes ARP
What is a vector?
History interval window
Displaying past position ARP
Past position displays
25.7 ARP, TTM target data
ARP target data
Tcpa time
25.8 CPA/TCPA alarm ARP
CPA distance
Showing, hiding ARP target tracks
Lost target alarm ARP
Canceling a lost target
Lost target mark
Multiple echoes
Interpreting the Radar Display
False echoes
Sidelobe echoes
Shadow sector
Appearance of Sart signal on the radar display
Sart Search and Rescue Transponder
Racon Radar Beacon
General procedure for detecting Sart response
Appearance of racon signal on the radar display
This page is intentionally left blank
Full-screen plotter display
Plotter Displays
Full-screen plotter display
Nav data window
Contents of nav data window
Plotter Operation
Compass display
Nav graphic display
Compass display
Reading the XTE cross-track error monitor
XTE range setting window
Anemometer display
Anemometer display
Highway display
Highway display
Nav data display
Nav data displays
North-up
Auto course-up
Perspective C-map only
Course-up
Chart card overview
Chart Scale
Chart Cards
Shifting the Display
When a chart cannot be displayed
Indices and chart enlargement
Sample chart Japan, showing indices
Plotter display, showing port service display
Navionics charts
Port service icons
Data for aids to navigation
Object information
Current or tide data
Current data display
Object information window
Find window
Objects window
MAP charts
Cursor and data display
Example of caution area window
Sample lighthouse data
Lighthouse icon
Object windows
Tide window
Map, port service display
Tide information
Port service icons
Own ship track
Working with Track
Displaying track
Track control menu
Stopping, restarting plotting of own ship track
Changing track color
Own ship track color window
Track plotting method and interval for own ship track
Own ship’s track
Track plotting method
Track plotting interval
Changing own ship track/mark distribution setting
Interval window
Interval windows
Erasing own ship track by area
Erasing track
Track memory window
Erase menu
Erasing all own ship track
Erasing own ship track by color
Erase track by color window
Erasing all target tracks
Changing mark attributes
Marks, Lines
Entering a mark, line
Marks & lines menu
Lines style window
Selecting line type
Marks shape window
Erasing an individual line
Erasing marks, lines
Erasing an individual mark
Erasing marks, lines by area
Entering a waypoint at own ship position
Waypoints
Entering waypoints
Entering a waypoint with the cursor
Waypoint mark shape selection window
Waypoint mark color selection window
Entering a waypoint by range and bearing
Entering a waypoint from the waypoint list
Editing waypoint data from the waypoint list
Editing waypoint data
Alphanumeric and local waypoint lists
Editing a waypoint from the plotter display
Plotter display
Erasing a waypoint from the menu
Erasing waypoints
Erasing a waypoint directly from the plotter display
Erasing a waypoint from the waypoint list
Chart details menu
Changing waypoint mark size Navionics Gold
Searching waypoints
Alphanumeric list
Entering a route with existing waypoints
Routes
Creating routes
Route menu
Entering a route with the cursor
Creating voyage-based routes
Displays for entry of time, distance interval
Save route menu
Save route window
Connecting routes
Connect route window
Edit route menu
Inserting waypoints
Inserting a waypoint from the route list
Waypoint list for editing a Route local list
Removing a waypoint from the route list
Removing waypoints from a route
Inserting a waypoint from the plotter display
Removing a waypoint from the plotter display
Navigating to a quick point
Navigation
Erasing routes
Selecting quick point entry method
Navigating to multiple quick points
Navigating to waypoints
Navigating to a single quick point
Selecting a waypoint from the plotter display
QP window
Navigating to ports, port services
Selecting an external waypoint
Port services and sample port list Ex. NavChart
Select Service
Plotter display, route selected as destination
Following a route
Selecting the route to follow
Navigating waypoints in reverse order
Log display
Example of when to restart navigation
Restarting navigation
Automatic waypoint switching methods
Setting speed for ETA calculation
Switching waypoints
Select speed for ETA window
Canceling route navigation
Alarms
Arrival alarm window
Arrival alarm
How the arrival alarm works
Anchor watch alarm window
Anchor watch alarm
How the anchor watch alarm works
How the XTE alarm works
XTE Cross-Track Error alarm
Speed alarm
XTE alarm window
Proximity alarm window
Proximity alarm
Trip alarm
Trip alarm window
Grounding alarm C-MAP specification
Grounding alarm window
Alarm information
Plotter alarm menu,
Message Meaning
Alarm messages
Plotter alarm messages and their meanings
Resetting Trip Distance
General setup menu,
This page intentionally left blank
Selecting a sounder display
Display mode window
Sounder Displays
Indications on the single frequency display
Description of sounder displays
Single-frequency display
Dual-frequency display
Marker-zoom display plus normal sounder display
Sounding area and transmission frequency
Marker-zoom display
Bottom-lock display
Bottom-zoom display
Bottom-zoom display plus normal sounder display
Bottom-lock display plus normal sounder display
Scope display display only
Bottom discrimination display
Bottom discrimination display
Scope display
How the automatic sounder works
Automatic Sounder Operation
Selecting screen split method in combination displays
Types of automatic sounder modes
Manual Sounder Operation
How to enable automatic sounder operation
Selecting the manual mode
Selecting display range
Examples of proper and improper gain
Adjusting the gain
Shifting the range
Gain window
Reducing Interference
How to measure depth and time
Measuring Depth, Time
Types of interference
Appearance of clutter
Reducing Low Level Noise
Noise limiter window
Clutter window
Appearance of weak echoes
Signal level window
Erasing Weak Echoes
Picture Advance Speed
Color bar 16 color when white marker function is active
White Marker
Advancement independent of ship’s speed
Picture advance window
How the speed-dependent picture advance mode works
Advancement synchronized with ship’s speed
Hue No Echo Color Background Color
Display Colors
Hue no. and background and echo colors
Alarm audio window
Audio alarm on/off
Sounder alarm menu
Bottom alarm window
Bottom alarm
Fish alarm
Fish alarm window
Fish alarm B/L window
Fish alarm B/L
Water temperature alarm
Water temperature alarm window
When an alarm setting is violated
Fish Alarm
Changing Pulse Repetition Rate
Water Temperature Graph
Sounder alarm messages and their meanings
Zero line
Saving Sounder Picture to an SD Card
Interpreting the Sounder Display
Zero line
Bottom echo
Bottom echoes
Fish school echoes
Fish school echoes
Surface noise/Aeration
Surface noise/aeration
This chapter intentionally left blank
Chapter
Save data menu
Deleting all data from memory cards other than chart data
Memory Card Operations
Memory card messages
Saving data to a memory card
Memory card messages
Message Reason Remedy
Playing back data from a memory card
Load data menu
Uploading or downloading data
Setting communication software on the PC
Uploading, Downloading Data
Upload and download menus
Waypoint data format
Baud rate window
Waypoint data format
Characters available for comment
End of sentence
Route data menu
Route comment data format
Loading Waypoint Data from Yeoman
Host name window
Receiving Data Via Network Equipment
Receive data menu
Marks & lines window
Outputting Data Through the Network
Select sentence menu
This page intentionally left blank
General Setup
General setup menu
Contents of general setup menu
Contents of general setup menu con’t from previous
Radar display setup menu
Radar Setup
Radar display setup
Contents of radar display setup menu
Con’t on next
Contents of radar display setup menu con’t from previous
Model Maximum Range
Radar range setup
Radar range setup menu
Radar function key menu
Function key setup
Function Key Default Function Function Key Label
Radar function key options
Radar function keys
Menu Item Function Function Key Label
Navigation options
Plotter Setup
Plotter setup menu Contents of plotter setup menu
Function Default Function Function Key Label
Plotter function key menu
Plotter function key options
Scroll
Plotter function keys
Plotter display, chart offset selected
Chart Setup
Chart offset
Navionics Gold chart attributes
Other SYMBOLS* White
Chart details menu C-MAP
MAP chart attributes
Displaying the Chart Details menu
Contour Line Soft key
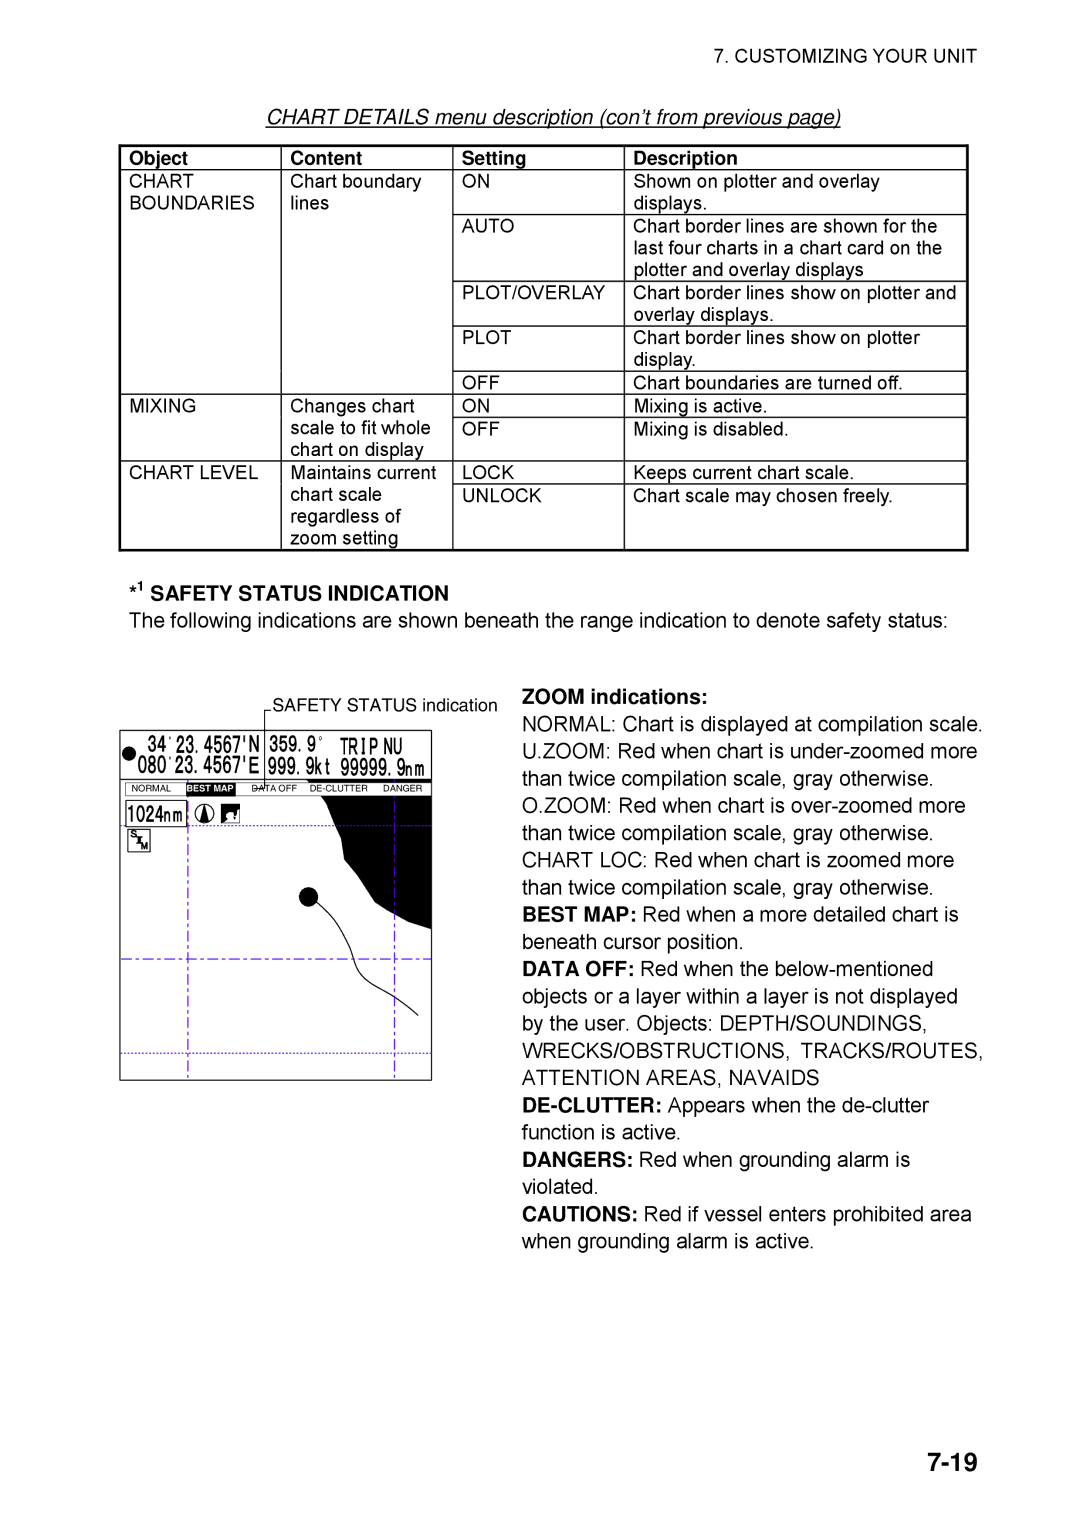
Object Content Settings Description
Chart Details menu description
Chart Details menu description
Chart Details menu description con’t from previous
Object Content Setting Description
Zoom indications
Auto
Depth Info menu
Setting Description Default Setting
Depth Info soft key
Depth Info menu description
Setting Setting Range Default Setting
Rocks Depth Limit Chooses range for rocks depth display
Data Boxes Setup
Data box menu
Hot Page Setup
Hot page setup menu
Combination screen selection window
Navigator Setup
Navigation data source
Contents of nav setup menu
GPS receiver setup Set equipped with GP-310B/320B
GPS setup menu Contents of GPS setup menu
Contents of GPS setup menu con’t on previous
GPS Status
TD setup menu
TD display setup
Contents of Waas Setup menu
Loran C GRI & station pair window
Displaying Loran C TDs
Loran GRI & station pair window
Displaying Decca TDs
Decca chain and station pair window
Nav data setup window
Nav Data Display Setup
Nav data setup screen
Sounder system setup menu
Sounder Setup
System setup
Sounder system setup menu description
HF,LF
Target
Sensor setup menu settings
Sensor setup
Sensor setup menu
Settings Default Setting
Sounding range, zoom range, bottom lock range
Sounder range setup menu
Default basic ranges
Zoom range and bottom-lock ranges
Sounder function key menu
OFF
Sounder function keys
Graphic meter window
Nav Graphic Display Setup
NAV Graphic menu
Depth graph up-date window
Check point Remedy
Preventive Maintenance
Maintenance program
Battery on circuit board
Replacement of Batteries
Replacement of Fuse
Batteries in remote controller
Replacing the Magnetron
Simple Troubleshooting
General troubleshooting
General
Radar
Radar troubleshooting
Plotter troubleshooting
Plotter
Sounder troubleshooting
Sounder
Memory I/O Test menu
Diagnostics
Memory I/O test
GPS receiver test results
Display unit test
GPS sensor test Requires GPS Receiver GP-310B/320B
Test pattern
Network sounder test results
Test pattern sequence
Keyboard, remote controller test
Screen for testing keyboard, remote controller
GPS Status Display
GPS status display
Windows for clearing memory
Clearing Memories
Memory clear menu
Error Message Meaning Remedy General
Error Messages
Error messages
This page is intentionally left blank
Menu Overview
AP-1
AP-2
Appendix
Setup
AP-3
AP-4
4800
AP-5
PURPLE, BLUE, White Interval TIME, Distance
AP-6
MAP
AP-7
AP-8
Zoom Marker ON, OFF HUE 1-9
Plotter Alarms
Alarm key
Radar Alarms
Sounder Alarms
Geodetic Chart List
AP-10
Icon Meaning
Icons
AP-11
AP-12
This page is intentionally left blank
Specifications of Marine Radar
Model 1724C/1734C
Transceiver Module
Plotter Function
Coating Color
Specifications of Video Plotter GD-1720C
This page is intentionally left blank
Index
IN-1
IN-2
IN-3
IN-4
Sart
IN-5
TVG