Model 1590
Model 1590
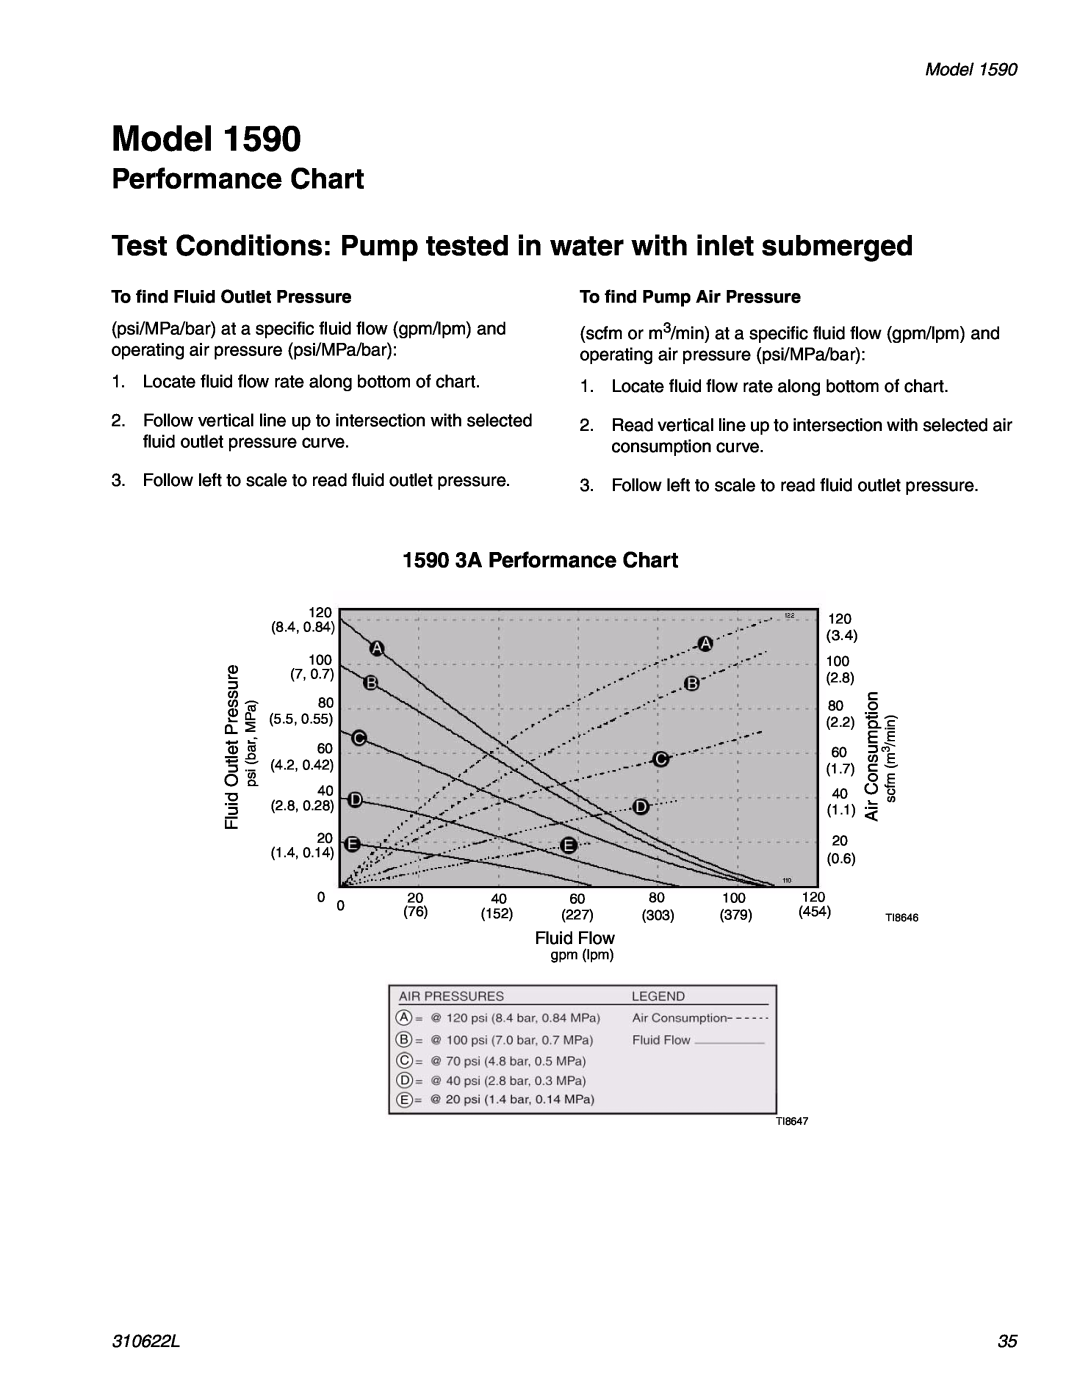
Performance Chart
Test Conditions: Pump tested in water with inlet submerged
To find Fluid Outlet Pressure
(psi/MPa/bar) at a specific fluid flow (gpm/lpm) and operating air pressure (psi/MPa/bar):
1.Locate fluid flow rate along bottom of chart.
2.Follow vertical line up to intersection with selected fluid outlet pressure curve.
3.Follow left to scale to read fluid outlet pressure.
To find Pump Air Pressure
(scfm or m3/min) at a specific fluid flow (gpm/lpm) and operating air pressure (psi/MPa/bar):
1.Locate fluid flow rate along bottom of chart.
2.Read vertical line up to intersection with selected air consumption curve.
3.Follow left to scale to read fluid outlet pressure.
1590 3A Performance Chart
Outlet Pressure | psi (bar, MPa) |
Fluid |
|
120 |
|
|
|
|
|
| 120 |
|
|
(8.4, 0.84) |
|
|
|
|
|
|
|
| |
|
|
|
|
|
| (3.4) |
|
| |
|
|
|
|
|
|
|
|
| |
100 |
|
|
|
|
|
| 100 |
|
|
(7, 0.7) |
|
|
|
|
|
| (2.8) | ConsumptionAir | (mscfm |
80 |
|
|
|
|
|
| 80 | ||
(5.5, 0.55) |
|
|
|
|
|
| (2.2) |
| /min) |
60 |
|
|
|
|
|
| 60 |
| |
|
|
|
|
|
|
| 3 | ||
(4.2, 0.42) |
|
|
|
|
|
| (1.7) |
|
|
40 |
|
|
|
|
|
| 40 |
|
|
(2.8, 0.28) |
|
|
|
|
|
| (1.1) |
|
|
|
|
|
|
|
|
|
|
| |
20 |
|
|
|
|
|
| 20 |
|
|
(1.4, 0.14) |
|
|
|
|
|
| (0.6) |
|
|
|
|
|
|
|
|
|
|
| |
0 | 0 | 20 | 40 | 60 | 80 | 100 | 120 |
|
|
|
| (76) | (152) | (227) | (303) | (379) | (454) |
| TI8646 |
Fluid Flow
gpm (lpm)
TI8647
310622L | 35 |