USER’S Guide
Page
Contents
Parametric aplet
Importing Sample Statistics from the Statistics aplet
Inference aplet
Variables and memory management
Programming
Index
+,7@CLEAR, 6+,7@MODES, 6+,7@ACOS, etc
Preface
Manual conventions
@, &26@, +20@, etc
Preface
On/off, cancel operations
Getting started
Home
To adjust the contrast To clear the display
Display
Parts of the display
Keyboard
Menu keys
Annunciator Description
Key Meaning
Aplet control keys
75@
+,7@
$/3+$@
175@
+,7@$/3+$@
Shifted keystrokes
Helpwith
Key Description
Math keys
Program commands Inactive keys
To cancel a menu
Menus
To search a menu
Input forms
Mode settings
Reset input form values
Setting Options
Setting Options
Setting a mode
Aplets E-lessons
Press+20@ to return to Home
Aplet Use this aplet to explore Name
N T
Quad Explorer aplet
*,*A, keys
Trig Explorer aplet
Aplets are stored in the Aplet library
Symbolic view Plot view Numeric view
Aplet library
Aplet views
Views menu contains the Plot-Table view
To change views
Aplet view configuration
Plot Setup Numeric Setup Symbolic
Configuration
Example
Mathematical calculations
Entering expressions
Long results Negative numbers
Scientific notation powers
Explicit and implicit multiplication
@4 6+,7@EEX @13@ @@6 6+,7@EEX 23@ j@ 3 6+,7@EEX 175@
+,7@√ @85 @9 @
Entering Calculates
@ 45 @6+,7@π
+,7@√ 85@9
Clearing numbers Using previous results
50175@ @25 175@175@
175@ updates ANS from 50 to 75 to
Accessing the display history
$/3+$@ a 175@
Key Function
Clearing the display history
Using fractions
Setting Fraction mode
See Setting fraction precision below for more information
Setting fraction precision
Evaluate the calculation
Fraction calculations Converting decimals to fractions
Return to Home and enter the calculation
@@@2@3
+ iy
Complex numbers
Converting a number to a fraction
Complex results To enter complex numbers
Catalog/Editor Contents
Catalogs and editors
Storing complex numbers
Trig Explorer and Quadratic Explorer aplets
Differences between the HP 38G and the HP 39G/40G
Memory manager Plot Goto function
Statistics Pred function
Page
Aplet views
About the Symbolic view
Defining an expression Symbolic view
Aplets and their views
Aplets and their views
Evaluating expressions
Aplets
Home
+,7@CLEAR
Symb view keys
$56@
$7+@
175@ or
Setting up the plot Plot view setup
Plot view settings
About the Plot view
Reset plot settings
Exploring the graph
Plot view keys
+,7@*A
Zoom options
Trace a graph
Zoom within a graph
To jump directly to a value To turn trace on/ off
Multiplies vertical scale only, using
Divides horizontal scale only, using
Multiplies horizontal scale, using
Divides vertical scale only, using
=220Zoom Out
018Zoom
=220Un-zoom
Press *k, to move to the bottom of the Zoom list
=220Y-Zoom Out
=220X-Zoom
=220X-Zoom Out
=220Y-Zoom
To box zoom To set zoom factors
Options
Other views for scaling and splitting the graph
Menu key copies the right plot to the left
Integer scaling Trigonometric scaling
About the numeric view
Overlay plots
Decimal scaling
Setting up the table numeric view setup
Numeric view settings
Reset numeric settings
Exploring the table of numbers
NUM view menu keys
Zoom within a table
175@, the values for the dependent variables are
Building your own table of numbers
Arrow keys to place the cursor in the independent variable
Column, then enter the value to jump to
Clear data
Build Your Own menu keys
Example plotting a circle
$3/7@ Select
+,7@√@9
Open the Function aplet
Function aplet
About the Function aplet
Getting started with the Function aplet
Plot the functions
Define the expressions
Plot the functions
@75@175@
Times
Change the scale Trace a graph
With FCN functions
Trace the linear function
Find the greater of the two roots of the quadratic function
SelectRoot
Root value is displayed at the bottom of the screen
@.2
2Select.Slope
Move the cursor to x = 1 by pressing the *A,or
Choose the end value for
Display the numeric view
Display the numeric view Set up the table
Display the numeric setup
To find the extremum of the quadratic
Move to X =
Match the table settings to the pixel columns in the graph
Explore the table
Display a table of numeric values
Area Extremum Isect Root Slope
Function aplet interactive analysis
Function Description
Access FCN variables FCN functions
Symbolic view. Displays
Cursor. You need to have at least
Two selected expressions
Plotting a piecewise defined function example
=
$3/ @ Select
Page
Open the Parametric aplet Define the expressions
Parametric aplet
About the Parametric aplet
Getting started with the Parametric aplet
Set angle measure Set up the plot Plot the expression
+,7@PLOT
360
120
Overlay plot Display the numbers
Plot a triangle graph over the existing circle graph
+,7@ Plot
Page
+,7@CLEAR 46+,7@π 2.a
Polar aplet
Getting started with the polar aplet
Open the Polar aplet
Explore the graph Display the numbers
Getting started with the Sequence aplet
Sequence aplet starts in the Symbolic view
Sequence aplet
About the Sequence aplet
Keys to assist in the entry of equations
Define the expression
Select Cobweb
Plot Setup, set the Seqplot option to Cobweb
Plot the sequence Display the table
Plot the Fibonacci sequence
Page
About the Solve aplet
Solve aplet
Getting started with the Solve aplet
Open the Solve aplet
Define the equation Define known variables
Solve the unknown variable Plot the equation
Solve for the unknown variable a
@ Select Auto
≈20 times
Solve aplet’s NUM view keys
Number format
Use an initial guess
Message Condition
Interpreting results
Root- Finder at work
180@ 30 175@ 2175@ *e,4175@ *e,*e, to highlight T
Plotting to find guesses
At2 x = v0t +
$/3+$@X
To move cursor to the intersection
Plot the graph
3175@*k,*k,*k
Using variables in equations
Home variables
Initial guess
1400 920 1100 2265 2890 2200
Statistics aplet
About the Statistics aplet
Getting started with the Statistics aplet
1400 175@920 175@ 1100 175@2265 175@ 2890 175@2200 175@
Open the Statistics aplet Enter data
175@1 175@ 175@5 175@ 175@4 175@
To move to the next column
Choose fit and data columns Explore statistics Setup plot
Select a fit in the Symbolic setup view
Select2. Linear
To move to the FIT1 +2field
Display the equation for the best linear fit
6175@
Entering and editing statistical data
$7+@ S to highlight
To highlight
+,7@� FXUVRU�
Statistics aplet’s NUM view keys
160 175@ 165 175@ 170 175@ 175 175@ 180 175@
$56@�
Sets will need to be selected again
Before re-use
Height cm Frequency
Angle Setting
Save data
Delete data
Select the Sort Order option. You can choose either
Defining a regression model 2VAR
Insert data Sort data values
To choose the fit
= ax3+bx2+cx+d. Needs at least
Fit models To define your own fit
Fit model Meaning
= m lnx + b
Computed statistics
One-variable
Statistic Definition
Columns for a linear fit only
Two-variable
Plotting
To plot statistical data
You can plot
Histogram Box and Whisker Plot Scatter Plot
Plot types
Coefficient
Relative Error
Fitting a curve to0182VAR data
Correlation
Plotting mark 2VAR Connected points 2VAR
Setting up the plot Plot setup view
Trouble-shooting a plot
Statistics aplet’s Plot view keys
Find predicted values
Calculating predicted values
Page
Example data
Default the input form contains example data. This example
Inference aplet
About the Inference aplet
Hypothesis Tests Confidence Intervals
Getting started with the Inference aplet
Open the Inference aplet
Inference aplet’s Symb view keys
∝.a∝
Define the inferential method
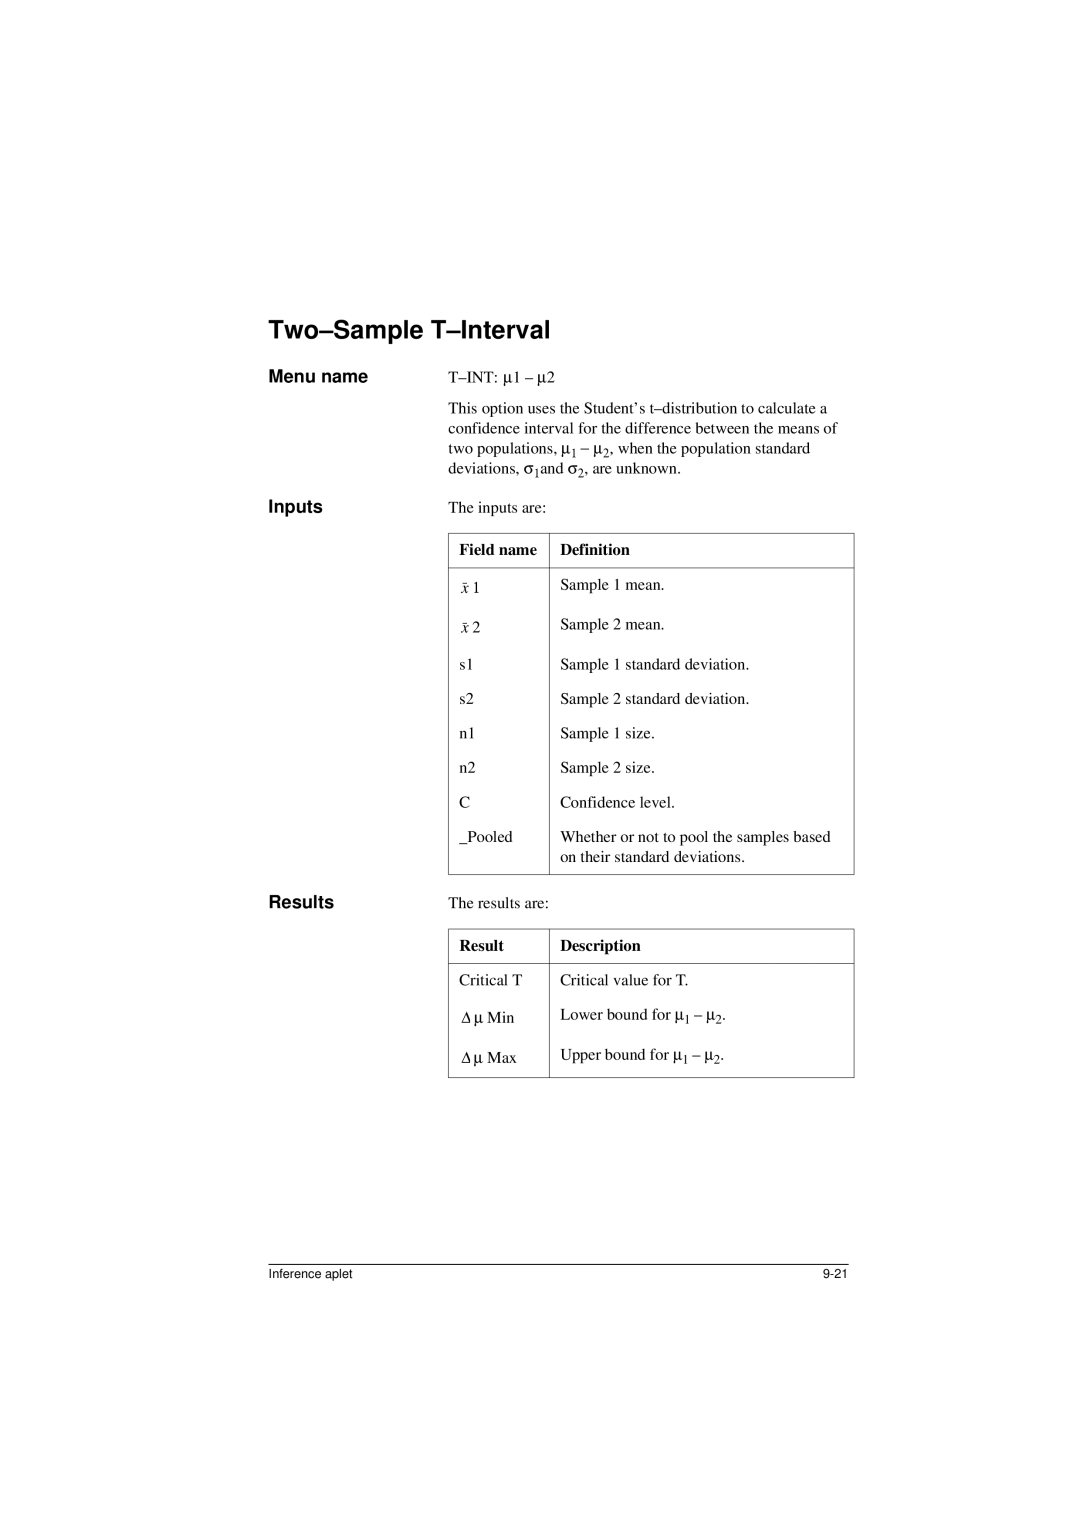
Field name Definition
Open the Statistics aplet
Open Statistics aplet. Note Reset current settings
Importing Sample Statistics from the Statistics aplet
Plot test results
@529 175@ @295 175@ @952 175@ @259 175@ @925 175@ @592 175@
Calculate statistics Open Inference aplet
Choose inference method and type
Import the data
2one.a
Display the confidence interval in the Plot view
Display Numeric view Display Plot view
Specify a 90% confidence interval in the C field
E, to move to Field
Inputs
Hypothesis tests
One-Sample Z-Test
Menu name
Two-Sample Z-Test
Results
Result Description
One-Proportion Z-Test
Two-Proportion Z-Test
Successes in the two populations is equal
H0 π1 = π2
Hypothesis is that the sample mean has some assumed value
One-Sample T-Test
Test 1 ∝
Selected hypothesis against the null hypothesis. The null
Two-Sample T-Test
Sample 2 standard deviation
Sample 1 standard deviation
Confidence level
Confidence intervals
Confidence interval calculations that the HP 39G/40G can
Perform are based on the Normal Z-distribution or Student’s
Deviations, σ1 and σ2, are known
Two populations, ∝1 ∝2, when the population standard
Two-Sample Z-Interval
Confidence interval for the difference between the means
Sample success count
One-Proportion Z-Interval
Sample 2 success count
Two-Proportion Z-Interval
Successes in two populations
Sample 1 success count
One-Sample T-Interval
Two-Sample T-Interval
Page
Using mathematical functions
Math functions
Math menu
To select a function
Function categories
Calculus Loop Stat-Two Complex Matrices
Math functions by category
Syntax
Functions common to keyboard and menus
Keyboard functions
+,7@√
+,7@ASIN
+,7@ACOS
+,7@ATAN
+,7@ n
Valuepower
+,7@ABS
ABSvalue
Lower,upper,expression,variable
Calculus functions
Taylor
Variableexpression
Complex number functions
ARG
Conj
Hyperbolic trigonometry
Constants
EXPM1
List functions
Alog
EXP
Recurse
Loop functions
Matrix functions
Iterate
Polyform
Polynomial functions
Polycoef
Polyeval
Random
Probability functions
Comb
Perm
Utpt
Utpc
Utpf
Utpn
Real-number functions
Mant
HMS→
→HMS
INT
RAD→DEG
MOD
Change
Total
Xpon
Statistics-Two
Sign
Truncate
Quad
Symbolic functions
Isolate
LINEAR?
Quote
Trigonometry functions
Home
Symbolic calculations
Symbolic calculations in the Function aplet
Using formal variables
Evaluate the function
Finding derivatives
To find derivatives
GG@$/3+$@S1
GG@@$/3+$@
To find derivatives in the Function aplet’s Symbolic view
Thus, substituting X for S1, it can be seen that
To find the indefinite integral using formal variables
+,7@GG@0 @ $/3+$@ S1 @ 3 @
Show the result format
10-26
Introduction
Variables and memory management
Storing and recalling variables
Numeric Precision
To store a value
To store the results of a calculation
65 @$/3+$@A 175@
Vars menu
To use variables
Calculations
+,7@LIST
Names or values of variables into programs
List names directly from the keyboard
2contents,.a is copied to the command line
$56@ *e,*e,*e,*A
$/3+$@L3175@
Category Available names
To access an aplet variable
Aplet variables
To copy the value of the variable into the edit line
+,7@MEMORY
Memory Manager
Start the Memory Manager. a list of variable categories
Is displayed
Page
Matrix Variables
Matrices
Vectors
Matrices
+,7@*e, or
Creating and storing matrices
Matrix Catalog keys
+ 7@CLEAR
Select the type of matrix to create
To create a matrix in the matrix catalog
+,7@*k, *e
Working with matrices
To transmit a matrix
Clears all elements from the matrix
728 672?
175@ 8 175@
Matrix arithmetic
To multiply and divide by a scalar
175@ 2175@*e 175@ 4175@
$/3+$@M1 j@$/3+$@M2 175@
$/3+$@M1@ $/3+$@M2 175@
+,7@MATRIX
Solving systems of linear equations
+,7@MATRIX1 175@
175@7 175@
About functions
Matrix functions and commands
Argument conventions
Inverse
Eigenval
Eigenvv
Idenmat
Schur
Rank
Rownorm
Rref
Identity Matrix Transposing a Matrix
Examples
Trace
TRN
Reduced-Row Echelon Form
Open the List catalog
Lists
Creating lists
Create a list in the List Catalog
List catalog keys
List edit keys
Create a list
@ /@
Displaying and editing lists
To display a list
To display one element To edit a list
To insert an element in a list To store one element
16a*e
To delete all lists
Deleting lists
Transmitting lists
To delete a list
List functions
$/3+$@A @
$/3+$@L 5175@ $7+@L *A
$/3+$@L5175@
$7+@L *A,Select
Sorts elements in ascending order
Calculates the product of all elements in list
POSlist, element
Calculates the number of elements in a list
Finding statistical values for list elements
89@65@ 0@89
$/3+$@ L1 175@
Go to the Numeric view To display calculated statistics
180@67$76a
Page
Your work is automatically saved. Press any view key
Aplet note view
To write a note in Note view
+,7@letter
+,7@ Cmds
+,7@%.63$=
Aplet sketch view
Sketch keys
To draw a line
Draw keys
Where you want any corner of the box to be
You can adjust the size of the box by moving the cursor
To draw a box
Keys
Press 2.again to affix the label
Highlight2. the variable name you want to use and press
Name of the note is ‘MYNOTE’
To import a graphics variable
To create a note
+,7@NOTEPAD
Another HP 39G/40G or PC
Opens the selected note for
Begins a new note, and asks for
Transmits the selected note to
14-8
Programming
Contents of a Program Structured Programming
Open Program catalog
Program catalog
+,7@*k, or *e
Program catalog keys
Create a new program
Creating and editing programs
To enter functions more to come
Enter commands Edit a program
+,7@CMDS
A,*e
Editing keys
Using programs
Debug a program Stop a program
Run a program From HOME, type RUN programname. or
Transmit a program Delete a program
Working with programs
Copy a
Program
Programs
Delete the contents of a program
About customizing an aplet
Delete all
Aplet naming convention
Customizing an aplet example
$3/7@Select
Configuring the Setviews menu option programs
Setviews ’’’’’’’’18
Programming 15-13
Select
Programming commands
Aplet commands
Check
Syntax for the command is as follows
Command syntax
Auto-run programs
If test-clause
Branch commands
Uncheck
IF...THEN...END
END
Iferr trap-clause Then error-clause END
IF... then
ELSE... END CASE...END Iferr Then
Drawing commands
Graphic commands
Grobxor
→GROB
Grobnot
Grobor
Loop commands
Matrix commands
Scaleadd
Randmat
Redim
Scale
Prompt commands
Print commands
Editmat matrixname
Disp
Disptime
Disp linenumbertextitem
Input nametitle,labelhelpdefault
Getkey
Input
Wait seconds
Msgbox
Prompt
Wait
Stat-One and Stat-Two commands
Stat-One commands
Stat-Two commands
Axes
Storing and retrieving variables in programs
Plot-view variables
Area
Grid
Coord
Extremum
FastRes
Isect
Hwidth
Indep
InvCross
S1mark-S5mark
Nmin / Nmax
Recenter
Root
Umin/Umax
Simult
Slope
StatPlot
Xcross
Tmin / Tmax
Tracing
Tstep
Ymin / Ymax
Xtick
Ytick
Xmin / Xmax
Angle
Symbolic-view variables
Xzoom
Yzoom
E1...E9, E0
X1, Y1...X9,Y9 X0,Y0
R1...R9, R0
U1...U9, U0
Numeric-view variables
C1...C9, C0
Digits
NumIndep
Format
NumCol
NumFont
NumType
NumRow
NumStart
NumStep
PageNum
Creating new aplets based on existing aplets
Extending aplets
Aplet Keys
$/3+$@ H 175@ $1@ $/3+$@ θ @
$/3+$@ C @ 175@
180@ 35 175@
$3/ @Select
Length of the ladder is approximately 8.72 metres
Resetting an aplet
Downloading e-lessons from the web
Solve for the missing
To transmit an aplet
Sending and receiving aplets
Sorting items in the aplet library menu list
To sort the aplet list
To delete an aplet
Reference information
Regulatory information
Canada
Warranty
LED safety
Reference information
To reset using the keyboard
Resetting the HP 39G/40G
To erase all memory and reset defaults
If the calculator does not turn on
21@ key
Cross matrix1,matrix2
Glossary
Operating temperature 0 to 45C 32 to 113F
Operating details
Batteries
Menu maps of the Vars menu
Home variables are
Category Available name
Function aplet variables are
Function aplet variables
User-named
Modes
Parametric aplet variables
Plot-FCN
Parametric aplet variables are
Polar aplet variables are
Polar aplet variables
Sequence aplet variables are
Sequence aplet variables
Solve aplet variables are
Solve aplet variables
Statistics aplet variables
Statistics aplet variables are
Stat-One
Calculus
Menu maps of the Math menu
Math functions
Math functions are
= =
Polynom
Program constants
Category Command
Program commands
Selected status messages
Message Meaning
+,7@ Memory
Function value, root, extremum
Or intersection is not visible
Current screen
Index
Index
Index
Index
Index
Index
Index
Index
Index
Index
Index
Index
Index