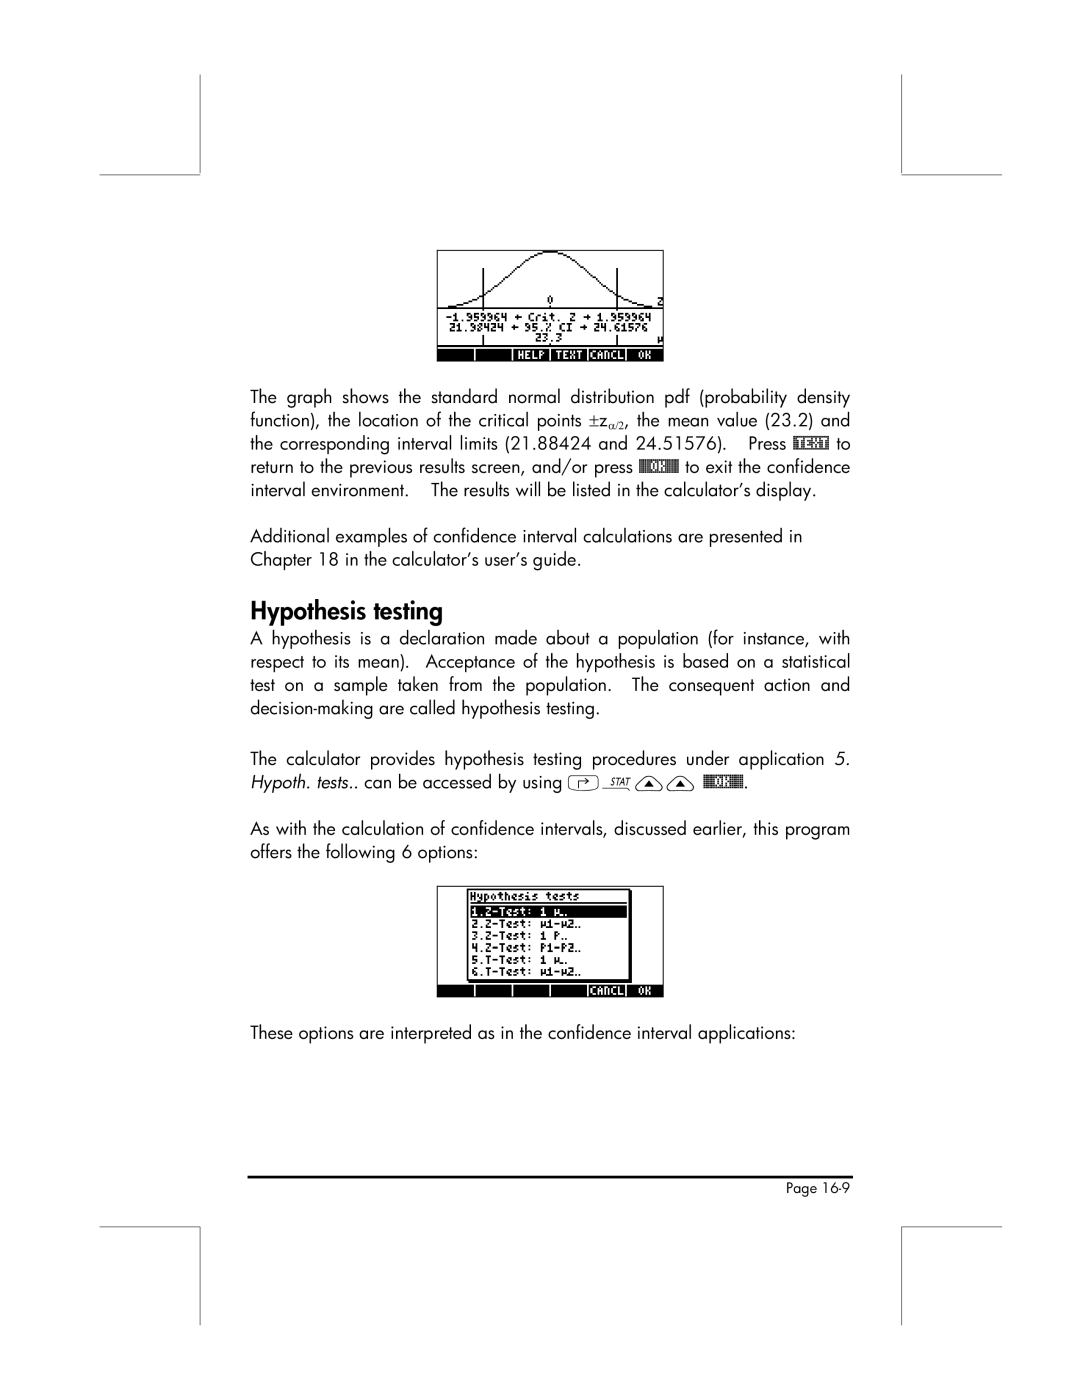
The graph shows the standard normal distribution pdf (probability density function), the location of the critical points ±zα/2, the mean value (23.2) and the corresponding interval limits (21.88424 and 24.51576). Press @TEXT to return to the previous results screen, and/or press @@@OK@@@ to exit the confidence interval environment. The results will be listed in the calculator’s display.
Additional examples of confidence interval calculations are presented in Chapter 18 in the calculator’s user’s guide.
Hypothesis testing
A hypothesis is a declaration made about a population (for instance, with respect to its mean). Acceptance of the hypothesis is based on a statistical test on a sample taken from the population. The consequent action and
The calculator provides hypothesis testing procedures under application 5. Hypoth. tests.. can be accessed by using
As with the calculation of confidence intervals, discussed earlier, this program offers the following 6 options:
These options are interpreted as in the confidence interval applications:
Page