Sun Microsystems, Inc
Page
Contents
To Access the Elom Using a Web Browser
To Clear the Event Log
Using the Remote Console Application
Using the Command-Line Interface
Using Ipmi
Using Simple Network Management Protocol
Glossary Index
Command-LineInterface Reference
Page
Figures
Page
How This Document Is Organized
Preface
Using Unix Commands
Related Documentation
Typographic Conventions
Third-Party Web Sites
Sun Documentation, Support, and Training
Sun Welcomes Your Comments
Sun Fire X4150 server Elom Overview
Embedded Lights Out Manager Common Tasks
Sun Fire X4150 server Elom Features
1ELOM Common Tasks
2SP Controller and Firmware Default Settings
Sun Fire X4150 server Default Settings
About the Indicator and Fault LEDs
About the Preconfigured Administrator Account
Connecting to the Elom
To Connect Using a Serial Connection
Connecting Using a Serial Connection
1Methods of Connecting to the Elom
About Connection Tasks
Enter the following command
Connecting Using Ethernet
Log in to the CLI
Enter the following command -exit
Connecting to the CLI
Click the Log Out button
Click Log
Page
Using the Web-Based Interface
Monitoring the Server System Using the Web-Based Interface
Users and Privileges
Browser and Software Requirements
Web-Based Interface Tasks
To Access the Elom Using a Web Browser
Accessing the Elom Using a Web Browser
1ELOM Tab Detail Choices
Viewing the System From the Web Browser
User Management
To View System Information
Viewing System and Component Information
Viewing Version Information To View SP Version Information
On the main menu, click the System Information tab
3Sample Server Board Information
Viewing Component Information To View CPU Information
4Sample CPU Information
Viewing Memory Information To View Memory Information
Monitoring the System Sensors
5Sample Memory Information
6Sample Memory for DIMMA0
Reading Sensors To Read Sensors
To Monitor the System Sensors
On the main menu, click System Monitoring
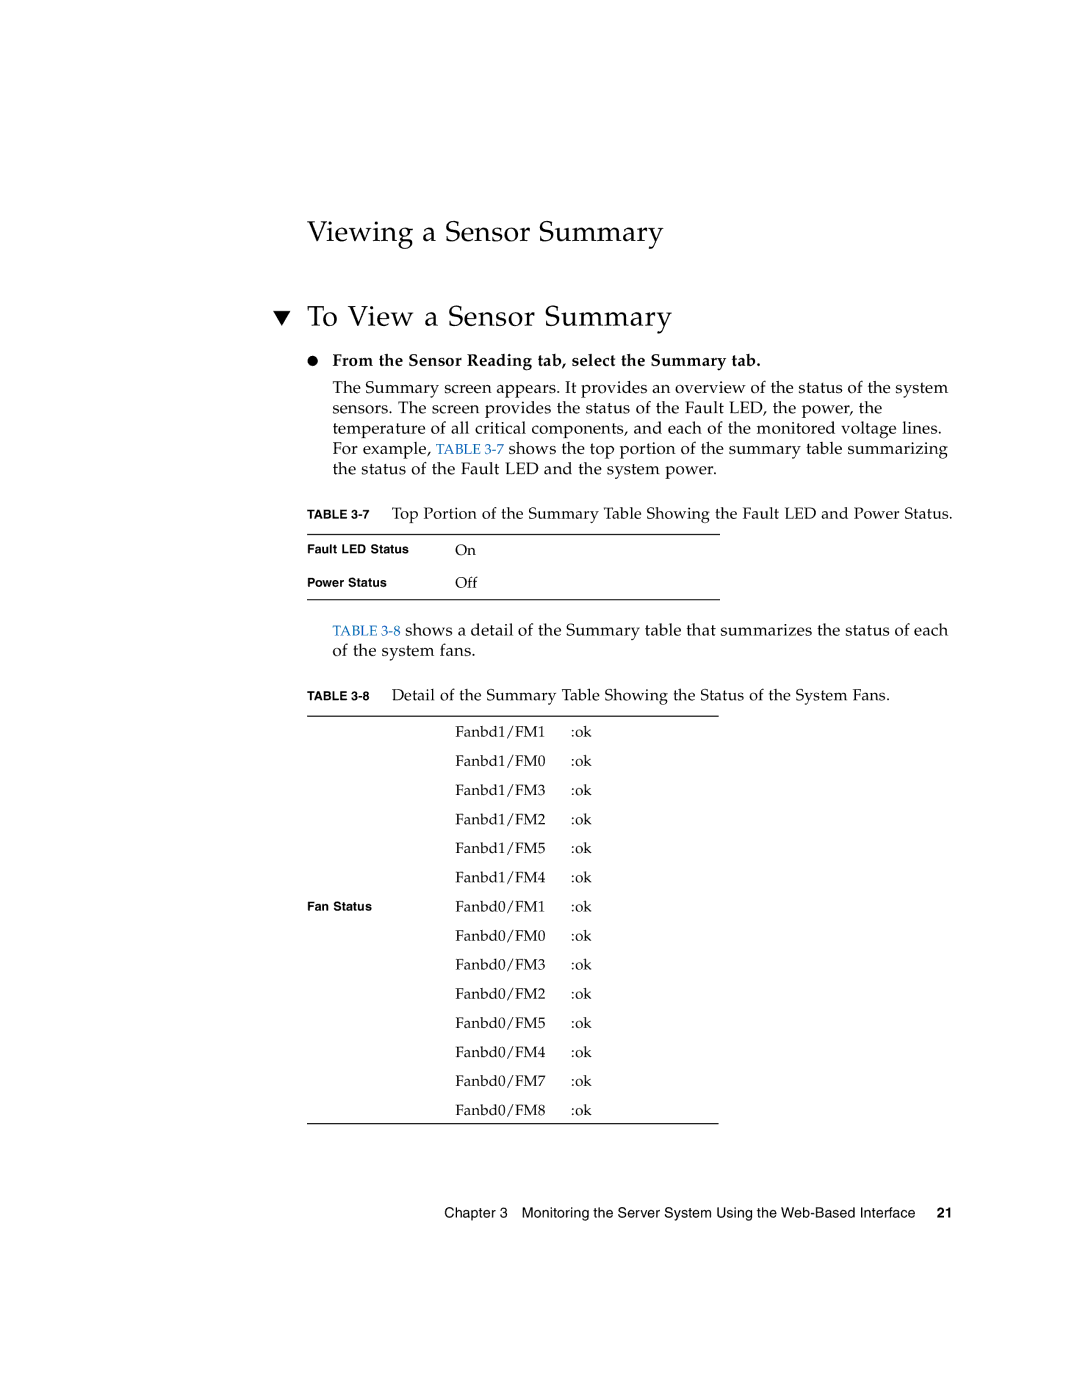
From the Sensor Reading tab, select the Summary tab
Viewing a Sensor Summary To View a Sensor Summary
CPU 0 Temp Too high
From the Sensor Reading tab, select the Temperature tab
Monitoring Temperatures To Monitor Temperatures
Monitoring Fans To Monitor Fans
From the Sensor Reading tab, select the Fan tab
Viewing and Managing the Event Log
Monitoring Voltages To Monitor Voltage
From the Sensor Reading tab, click the Voltage tab
14Sample of the Voltage Monitor Screen
To View the Event Logs
To Display the Event Log
To Save the Event Log
From the Event Logs tab, select View Event Logs
To Clear the Event Log
Chapter
Configuring the System
From the main menu, click the Configuration tab
To Configure the System
To Configure E-mail Notification
Configuring E-mail Notification
Configuring Platform Event Filters
From the Configure submenu, click the Network tab
To Configure a Platform Event Filter
Options are Ffh All sensors
To access the System Management Access Submenus
Configuring System Management Access
Click Submit to create the filter
Click Generate to create a new CSR
Configuring Snmp
1Example of Required SSL Information
To Add an Snmp Community
To Configure Snmp
To Modify an Snmp Community
To Delete an Snmp Community
To Add an Snmp User
To Delete an Snmp User
Configuring Active Directory Service
To Edit an Snmp User
Click Submit to create the new user
Managing and Maintaining the System
To Configure Active Directory Service
Managing Users and Accounts
To Add a User
3The User Management Screen
Type a password in the Password field
To Disable or Enable a User
To Change a User Password or Privilege
To Delete a User Account
To Control the State of the System Indicator LED
Managing the System Locator Indicator LED
Managing the Front Panel and On-Board Fault LEDs
To Turn the Fault LEDs Off
To View the State of the Fault LEDs
To Set Power Control
Setting Power Control
Resetting the Service Processor
To Reset the Service Processor
Click Reset SP button
Updating the Firmware Using a Web Browser
Updating the Firmware
Recovering from a Corrupt SP
To Update the Firmware Using a Web Browser
Select the firmware file or Cpld file to update
To Recover From a Corrupt SP
To Set the Session Timeout
Managing Session Timeout
To Disable the Session Timeout
Click the Submit button to set the session timeout
From the Configuration submenu, click the Set Time tab
Setting the Time To Set the Time
Page
Requirements
Accessing the Remote Console
CD and Diskette Redirection Operational Model
1Client Installation Requirements
2Remote Console Operation With DVD Drive and Diskette Drive
Starting the Remote Console Application
Click Login
To Start the Remote Console Application
Click Launch
From the Remote Control submenu, select Hotkey Setup
Setting Parameters for the Remote Console
To Set Parameters for the Remote Console
To Redirect Keyboard and Mouse Devices
Redirecting Keyboard, Video, Mouse, or Storage Devices
Select a source device from the drop-down list
To Redirect Storage Devices
To Install an OS on a Remote Server Using a Virtual CD-ROM
Installing an Operating System on a Remote Server
Type the user name and password in the login screen
Other Remote Options
Page
About Ipmi
Using Ipmi
Sensors
IPMItool
1Supported Ipmi 2.0 Commands
Supported Ipmi 2.0 Commands
General Commands
2Supported Ipmi 2.0 Commands
FRU Device Commands
Serial/Modem Device Commands
2Supported Ipmi 2.0 Commands
Page
Logging In to the CLI
Using the Command-Line Interface
Syntax
Command Syntax
2CLI Options
1CLI Command Verbs
Managing the Host State
Managing the Host
Viewing Host Sensors
Managing the Host Console
To Display Network Settings
Managing Elom Network Settings
To Configure Network Settings
Targets, Properties, and Values
Managing Local User Accounts With
To Display User Accounts Using the CLI
To Delete a User Account Using the CLI
Enter the following command delete /SP/users/username
Enter the following command show /SP/users
Configuring User Accounts
Displaying Alerts
Managing Alerts
To Display Alerts
Output of the show command appears
Configuring Alerts
Configuring the PEF Global Controls
Configuring the Event Filter Tables
To Configure the PEF Global Controls
To Configure the Event Filter Tables
Result of executing the show command appears
To Display the Current SP Version Information
Displaying Version Information
To update the firmware, enter one of the following commands
To Update the Firmware
Updating the Firmware
Select Yes to continue, or No to exit
Start the Tftp download
Page
How Snmp Works
About Snmp
MIBs Integration
Snmp MIB Files
1Sun Server MIB Tree
Snmp Messages
Configuring Receipt of Snmp Traps
Configuring Snmp on the Elom
Managing Snmp User Accounts
Adding Your Server to Your Snmp Environment
1SNMP Targets, Properties, and Values
Deleting a User Account
Show
Table A-1Command Syntax and Usage
CLI Command Quick Reference
Table A-3User Commands
Table A-2General Commands
Table A-4Network and Serial Port Setting Commands
Table A-6SNMP Commands
Table A-5Alert Commands
Table A-7System Start, Stop, and Reset Commands
Set /SYS/CtrlInfo PowerCtrl=reset
CLI Command Reference
Example
Create
Delete
Table A-9delete Command Targets
Exit
Usage load -source URL target
Help
Set
Table A-10set Command Targets, Properties, and Values
SP/AgentInfo/SNMP/user
Show
Start
Start Command Target
Table A-12stop Command Target
Reset
Stop
Version
Page
Address Resolution
Access control list
Advanced Configuration Power Interface
Glossary
Advanced Technology
Advanced Programmable Interrupt Controller
Advanced Technology Attachment Packet
Alert Standard Format
Certificate Authority
Bios Basic
Common Information
Command-line interface
Coordinated Universal
Customer-replaceable
Domain name server Domain name service
Direct memory access
Digital Signature
Distinguished Name
Dynamic random access
Dynamic Host Configuration Protocol
Domain Name System Dual inline memory
Electrically erasable programmable read- only memory
Externally initiated
Erasable programmable read-only memory
Fibre Channel Arbitrated Loop
Field-replaceable unit
Fully qualified domain
File Transfer Protocol
Grand Unified
Graphical user interface
Hypertext Transfer Protocol Secure
Hypertext Transfer
In-band system
Internet Control Message Protocol
Intelligent Platform Management Interface
Internet Protocol IP
Interrupt request
JumpStart
Java Web Start
Keyboard Controller
Keyboard, video, mouse, storage
Lightweight Directory Access Protocol Ldap
Lightweight Directory Access Protocol
Media access control
Local area network
Network file system
Nonvolatile random access memory
Network Information
Network interface card
Out-of-band OOB
Object identifier
Peripheral Component
Peripheral Interface
Preboot Execution
Power-on self-test
Platform Event Filter
Platform Event Trap
Programmable read- only memory
Redundant array of independent disks
Remote procedure call
Remote Management Control Protocol
Sensor data record
Secure Sockets Layer
Serial Attached Scsi
Server Message Block
Small Computer System Interface
Simple Network Management Protocol
Spanning Tree Protocol
System event log
Transmission control
Uninterruptible power
Transmission Control Protocol/Internet
Trivial File Transport
UserID a unique string identifying a user to a system
User identification
User identification number UID
Voltage regulator
Page
Index
LED
Index