Deployment
Example:\
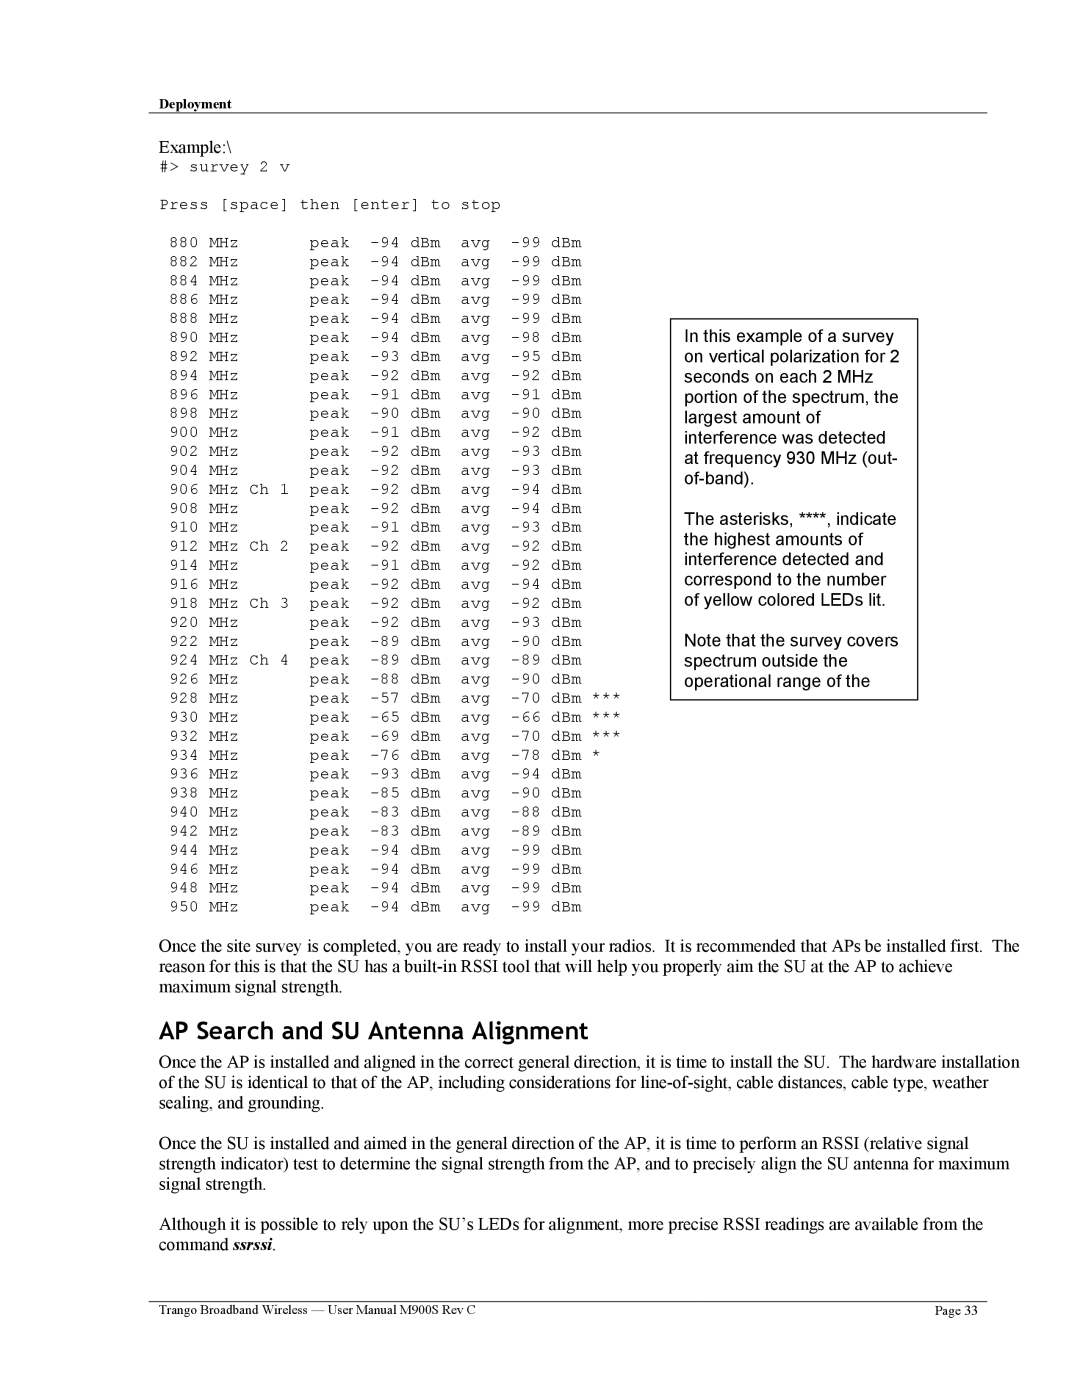
#> survey 2 v
Press [space] then [enter] to stop
880 | MHz | peak | avg | ||
882 | MHz | peak | avg | ||
884 | MHz | peak | avg | ||
886 | MHz | peak | avg | ||
888 | MHz | peak | avg | ||
890 | MHz | peak | avg | ||
892 | MHz | peak | avg | ||
894 | MHz | peak | avg | ||
896 | MHz | peak | avg | ||
898 | MHz | peak | avg | ||
900 | MHz | peak | avg | ||
902 | MHz | peak | avg | ||
904 | MHz | peak | avg | ||
906 | MHz Ch 1 | peak | avg | ||
908 | MHz | peak | avg | ||
910 | MHz | peak | avg | ||
912 | MHz Ch 2 | peak | avg | ||
914 | MHz | peak | avg | ||
916 | MHz | peak | avg | ||
918 | MHz Ch 3 | peak | avg | ||
920 | MHz | peak | avg | ||
922 | MHz | peak | avg | ||
924 | MHz Ch 4 | peak | avg | ||
926 | MHz | peak | avg | ||
928 | MHz | peak | avg | ||
930 | MHz | peak | avg | ||
932 | MHz | peak | avg | ||
934 | MHz | peak | avg | ||
936 | MHz | peak | avg | ||
938 | MHz | peak | avg | ||
940 | MHz | peak | avg | ||
942 | MHz | peak | avg | ||
944 | MHz | peak | avg | ||
946 | MHz | peak | avg | ||
948 | MHz | peak | avg | ||
950 | MHz | peak | avg |
In this example of a survey on vertical polarization for 2 seconds on each 2 MHz portion of the spectrum, the largest amount of interference was detected at frequency 930 MHz (out-
The asterisks, ****, indicate the highest amounts of interference detected and correspond to the number of yellow colored LEDs lit.
Note that the survey covers spectrum outside the operational range of the
Once the site survey is completed, you are ready to install your radios. It is recommended that APs be installed first. The reason for this is that the SU has a
AP Search and SU Antenna Alignment
Once the AP is installed and aligned in the correct general direction, it is time to install the SU. The hardware installation of the SU is identical to that of the AP, including considerations for
Once the SU is installed and aimed in the general direction of the AP, it is time to perform an RSSI (relative signal strength indicator) test to determine the signal strength from the AP, and to precisely align the SU antenna for maximum signal strength.
Although it is possible to rely upon the SU’s LEDs for alignment, more precise RSSI readings are available from the command ssrssi.
Trango Broadband Wireless — User Manual M900S Rev C | Page 33 |