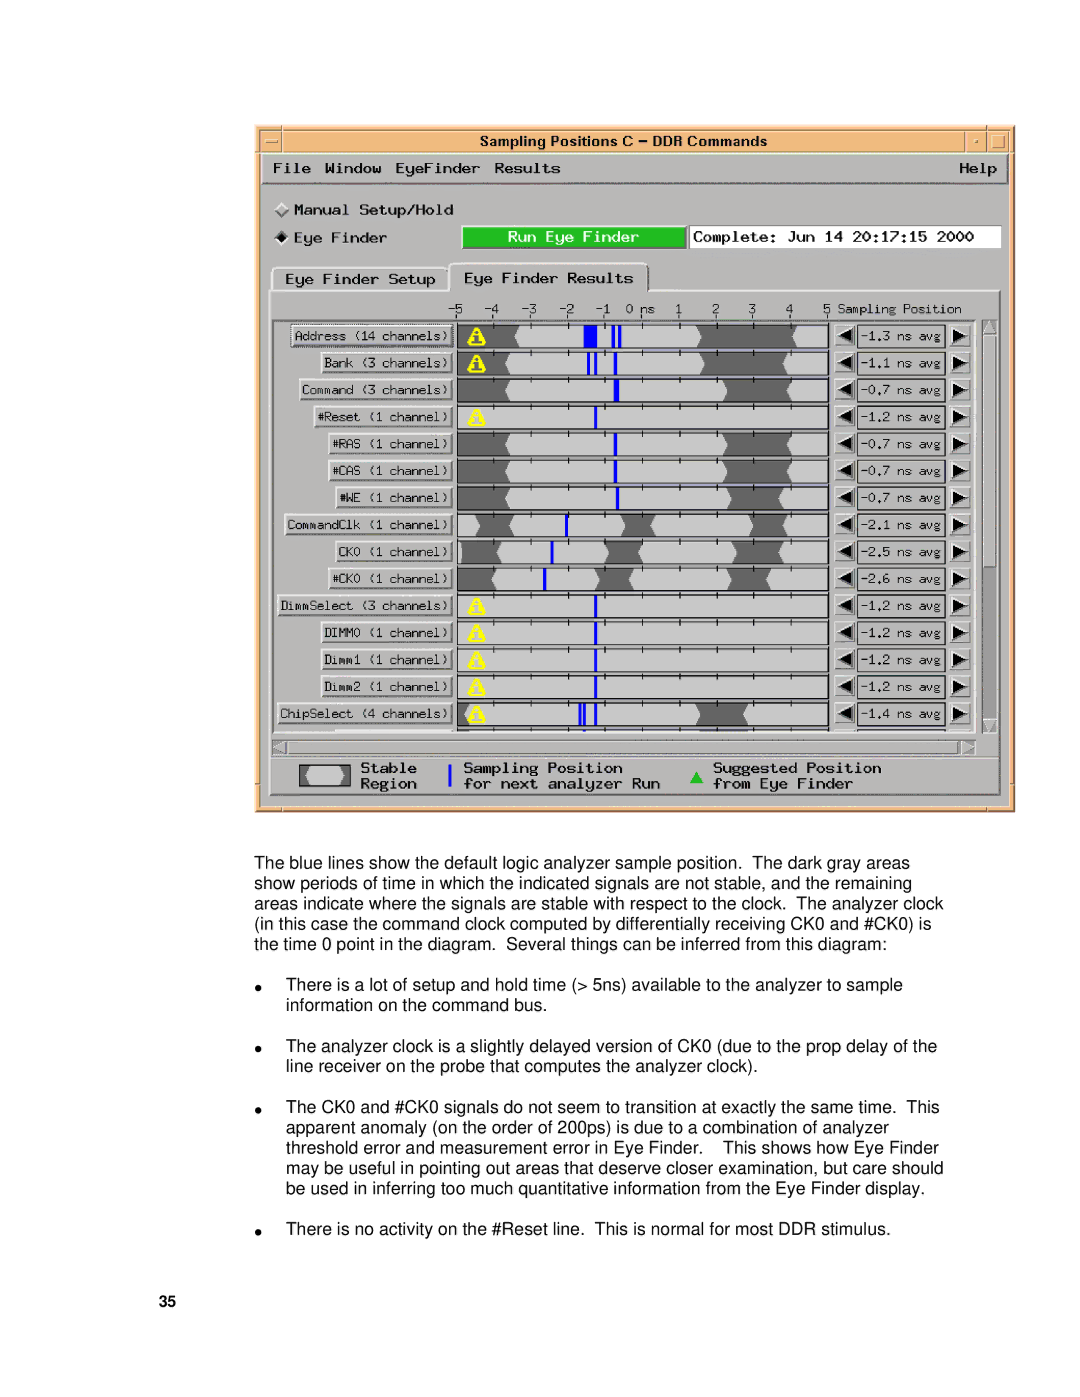
The blue lines show the default logic analyzer sample position. The dark gray areas show periods of time in which the indicated signals are not stable, and the remaining areas indicate where the signals are stable with respect to the clock. The analyzer clock (in this case the command clock computed by differentially receiving CK0 and #CK0) is the time 0 point in the diagram. Several things can be inferred from this diagram:
∙There is a lot of setup and hold time (> 5ns) available to the analyzer to sample information on the command bus.
∙The analyzer clock is a slightly delayed version of CK0 (due to the prop delay of the line receiver on the probe that computes the analyzer clock).
∙The CK0 and #CK0 signals do not seem to transition at exactly the same time. This apparent anomaly (on the order of 200ps) is due to a combination of analyzer threshold error and measurement error in Eye Finder. This shows how Eye Finder may be useful in pointing out areas that deserve closer examination, but care should be used in inferring too much quantitative information from the Eye Finder display.
∙There is no activity on the #Reset line. This is normal for most DDR stimulus.
35