Screen of lap data
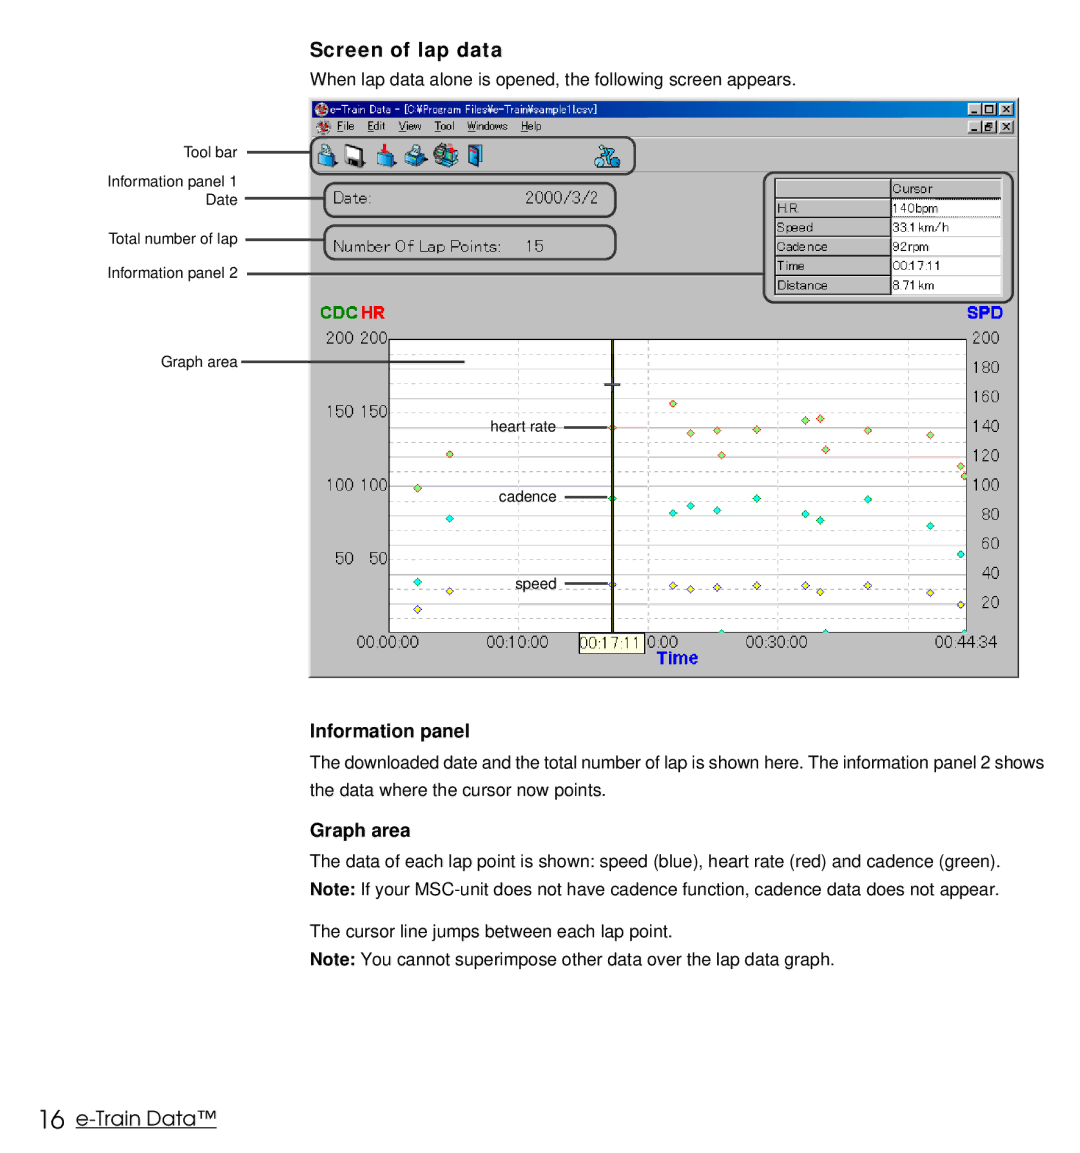
When lap data alone is opened, the following screen appears.
Tool bar
Information panel 1
Date
Total number of lap
Information panel 2
Graph area
heart rate
cadence
speed
Information panel
The downloaded date and the total number of lap is shown here. The information panel 2 shows the data where the cursor now points.
Graph area
The data of each lap point is shown: speed (blue), heart rate (red) and cadence (green).
Note: If your
The cursor line jumps between each lap point.
Note: You cannot superimpose other data over the lap data graph.
