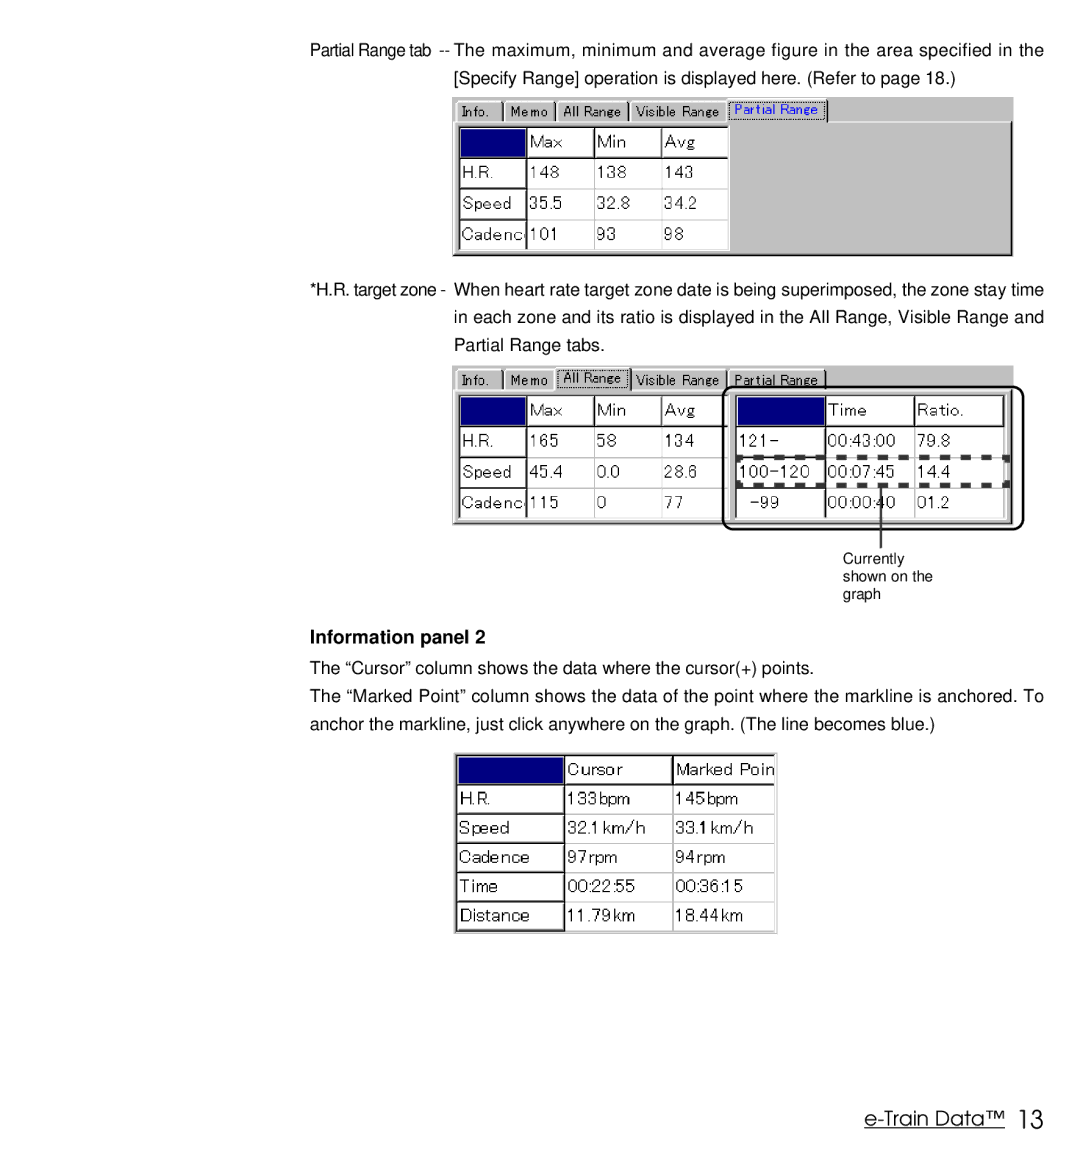
Partial Range tab
*H.R. target zone - When heart rate target zone date is being superimposed, the zone stay time in each zone and its ratio is displayed in the All Range, Visible Range and Partial Range tabs.
Currently shown on the graph
Information panel 2
The “Cursor” column shows the data where the cursor(+) points.
The “Marked Point” column shows the data of the point where the markline is anchored. To anchor the markline, just click anywhere on the graph. (The line becomes blue.)