User’s Guide – version 3.5 | NetFlow Tracker |
Device traffic meters
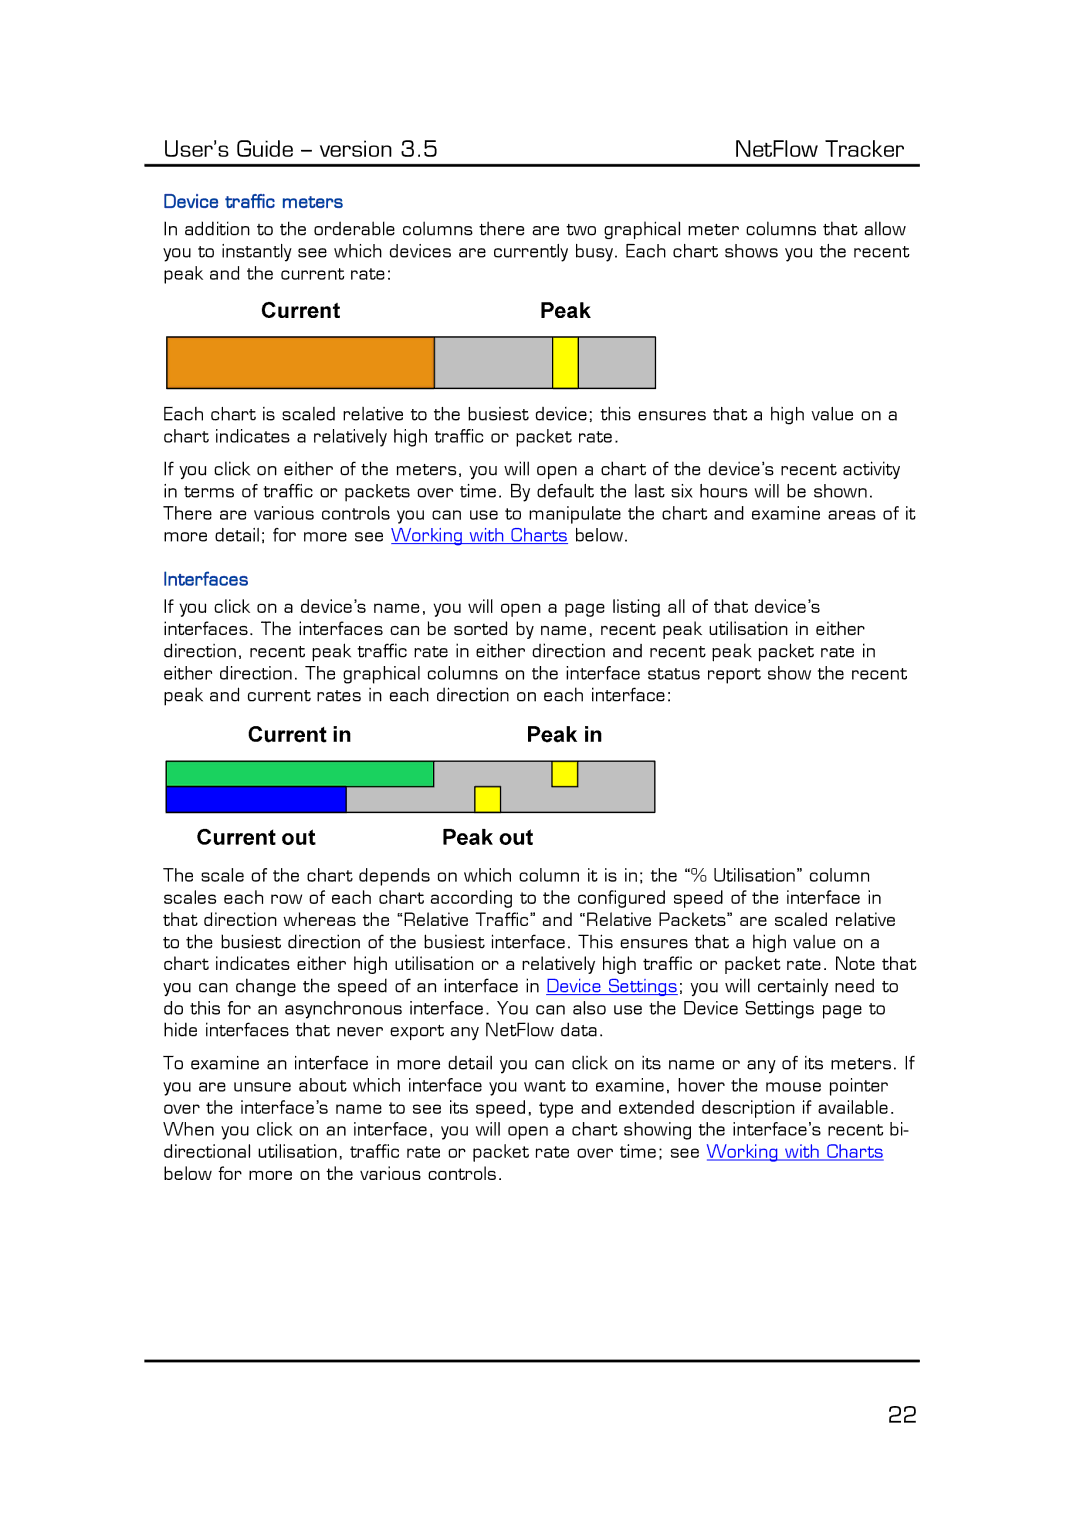
In addition to the orderable columns there are two graphical meter columns that allow you to instantly see which devices are currently busy. Each chart shows you the recent peak and the current rate:
Each chart is scaled relative to the busiest device; this ensures that a high value on a chart indicates a relatively high traffic or packet rate.
If you click on either of the meters, you will open a chart of the device’s recent activity in terms of traffic or packets over time. By default the last six hours will be shown. There are various controls you can use to manipulate the chart and examine areas of it more detail; for more see Working with Charts below.
Interfaces
If you click on a device’s name, you will open a page listing all of that device’s interfaces. The interfaces can be sorted by name, recent peak utilisation in either direction, recent peak traffic rate in either direction and recent peak packet rate in either direction. The graphical columns on the interface status report show the recent peak and current rates in each direction on each interface:
The scale of the chart depends on which column it is in; the “% Utilisation” column scales each row of each chart according to the configured speed of the interface in that direction whereas the “Relative Traffic” and “Relative Packets” are scaled relative to the busiest direction of the busiest interface. This ensures that a high value on a chart indicates either high utilisation or a relatively high traffic or packet rate. Note that you can change the speed of an interface in Device Settings; you will certainly need to do this for an asynchronous interface. You can also use the Device Settings page to hide interfaces that never export any NetFlow data.
To examine an interface in more detail you can click on its name or any of its meters. If you are unsure about which interface you want to examine, hover the mouse pointer over the interface’s name to see its speed, type and extended description if available. When you click on an interface, you will open a chart showing the interface’s recent bi- directional utilisation, traffic rate or packet rate over time; see Working with Charts below for more on the various controls.
22
