User’s Guide – version 3.5 | NetFlow Tracker |
Working with Pie Charts
Most charts can be displayed instead as a pie chart. Rather than breaking the selected time range into small chunks and charting each one, a pie chart shows each of the top element’s proportion of the total octets or packets during the entire time range.
Most of the toolbar buttons used for working with a chart are also used for working with a tabular report; however there are some differences.
View a pie chart as a standard chart
You can view a pie chart as a chart over time by clicking the chart toolbar button:
Working with Tabular Reports
Most charts can be displayed instead as a tabular report. Rather than breaking the selected time range into small chunks and charting each one, a tabular report shows the entire time range in one table. A tabular report also shows every contributing element rather than just the largest ones.
Many of the toolbar buttons used for working with a chart are also used for working with a tabular report; however there are some differences.
Filtered utilisation
If the source data for a report is filtered by interface, the total utilisation of all the traffic displayed in the report as a percentage of the interface bandwidth is shown under the interface name. This can help you judge whether an element’s traffic is significant or not.
View a tabular report as a chart
You can view a report as a chart by clicking the chart toolbar button:
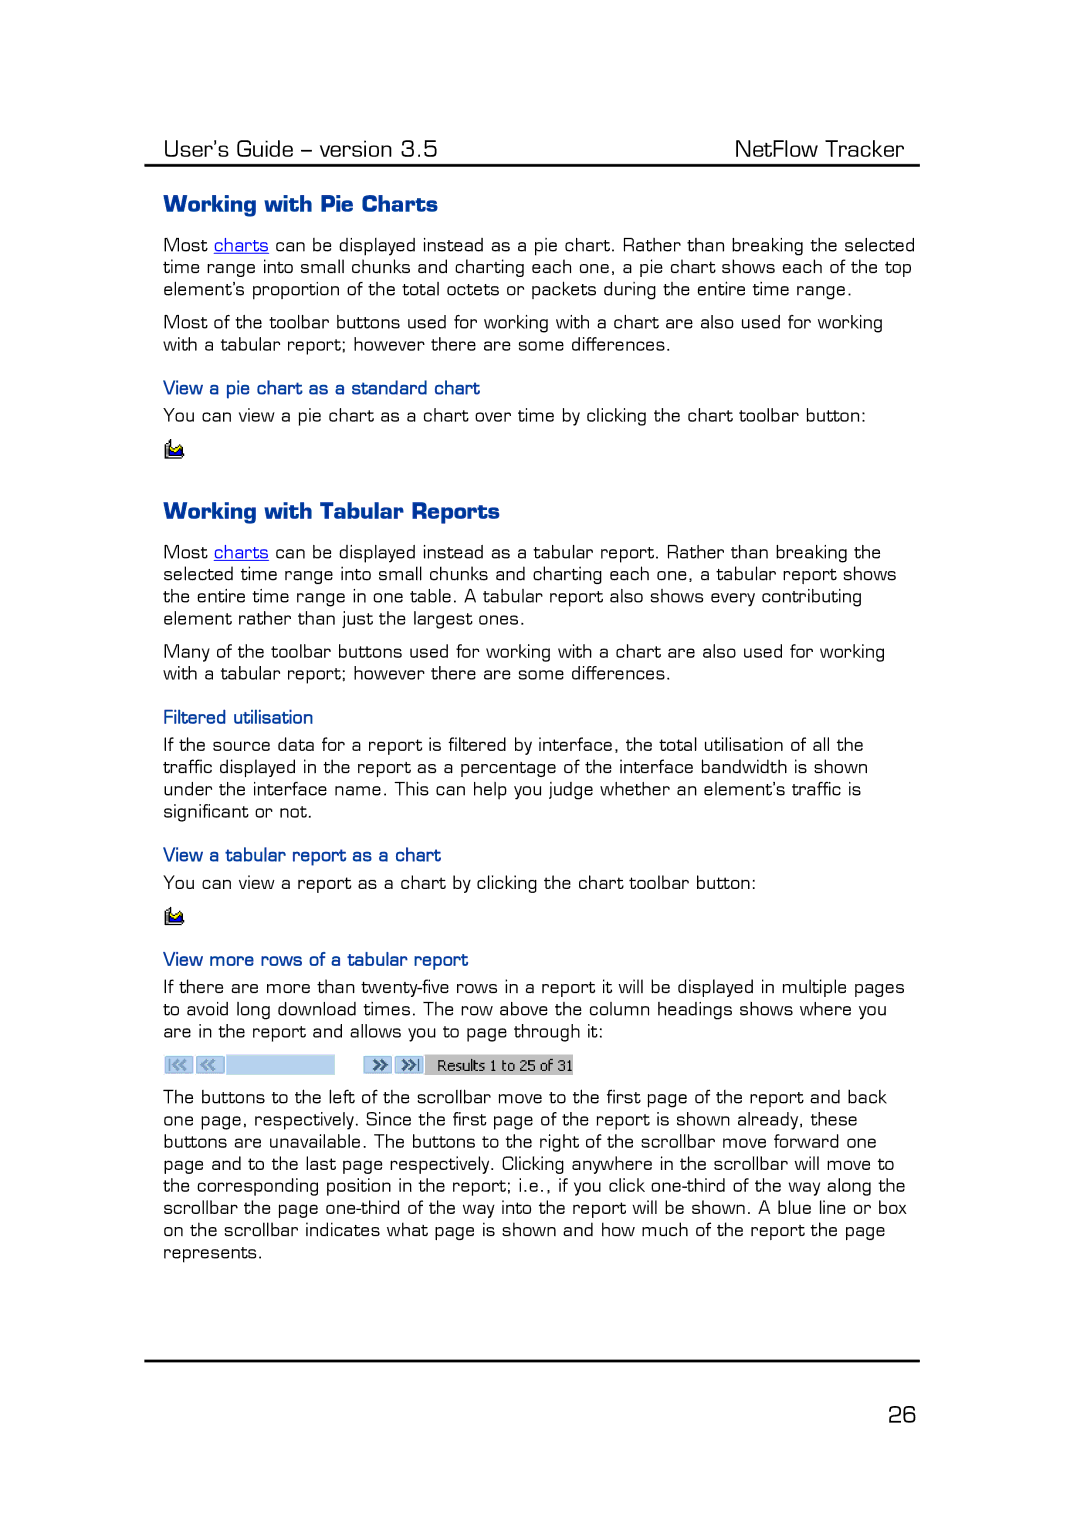
View more rows of a tabular report
If there are more than
The buttons to the left of the scrollbar move to the first page of the report and back one page, respectively. Since the first page of the report is shown already, these buttons are unavailable. The buttons to the right of the scrollbar move forward one page and to the last page respectively. Clicking anywhere in the scrollbar will move to the corresponding position in the report; i.e., if you click
26