M I N I S T R a T I O N G U I D E
Regulatory compliance
Trademarks
FCC Class a Part 15 CSA/CUS
Contents
Viewing session information Filtering session information
Radius Server Administrator Settings
Log Receive Monitor Intrusion Activity
Adding a route
Device
Content Archive 107
Log
Quarantine 131
Reports 113
Alert 133
Network Analyzer 141
Managing firmware versions 169
Tools 157
Index 213
Appendix FortiAnalyzer reports in 3.0 MR7 185
About this document
Introduction
Fortinet documentation
Describes how to install and set up the FortiAnalyzer unit
Fortinet Tools and Documentation CD
Customer service and technical support
Fortinet Knowledge Center
Comments on Fortinet technical documentation
Customer service and technical support
High-end FortiAnalyzer units support additional
What’s new for 3.0 MR7
FortiAnalyzerVersion 3.0 MR7 Administration Guide
Power supply monitoring for FortiAnlayzer-2000A and 4000A
MR7 new features and changes
Registered devices’ hard limits
CLI displays the tasks in the upload queue
Config log settings Set custom-field1-5
Report configuration enhancements
Custom fields for log messages
Reports
All other reports, for example
VoIP reports
ReportHeadquarters-2008-05-26-1030
Alert email configuration changes
About administrative domains ADOMs
Administrative Domains ADOMs
About administrative domains ADOMs
FortiAnalyzer Model Number of Administrative Domains
To enable ADOMs
Configuring ADOMs
Go to System Admin Settings
Enable Admin Domain Configuration Select OK Message appears
Go to Global Configuration System Admin Settings
To disable ADOMs
To add or edit an Adom
Select OK FortiAnalyzer unit logs you out
Assigning administrators to an Adom
Accessing ADOMs as the admin administrator
To access an Adom
To assign an administrator to an Adom
Dashboard
System
System Information
To refresh a Dashboard widget Go to System Dashboard
To rearrange a Dashboard widget Go to System Dashboard
To include a Dashboard widget Go to System Dashboard
Tabs
To omit a Dashboard widget Go to System Dashboard
To add a tab Go to System Dashboard
RAID Monitor
Double-click on the name of the tab and select the X symbol
Enter a new name and press Enter
To delete a tab Go to System Dashboard
Rebuilding icon
System Information
05-30007-0082-20080908
Setting the time
Changing the firmware
Changing the host name
License Information
To change the host name Go to System Dashboard
Viewing operational history
System Resources
RVS Plug-ins Device License
Memory Usage
Formatting the log disks
System Operation
To format the log disks Go to System Dashboard
Systems Operations area, select Format Log Disks Select OK
Alert Message Console
Resetting to the default configuration
Viewing alert console messages
To view alert console messages Go to System Dashboard
Viewing session information
Statistics
Select the delete icon
Connections
Report Engine
Filtering session information
To view the session information Go to System Dashboard
Statistics area, next to Connections, select Details
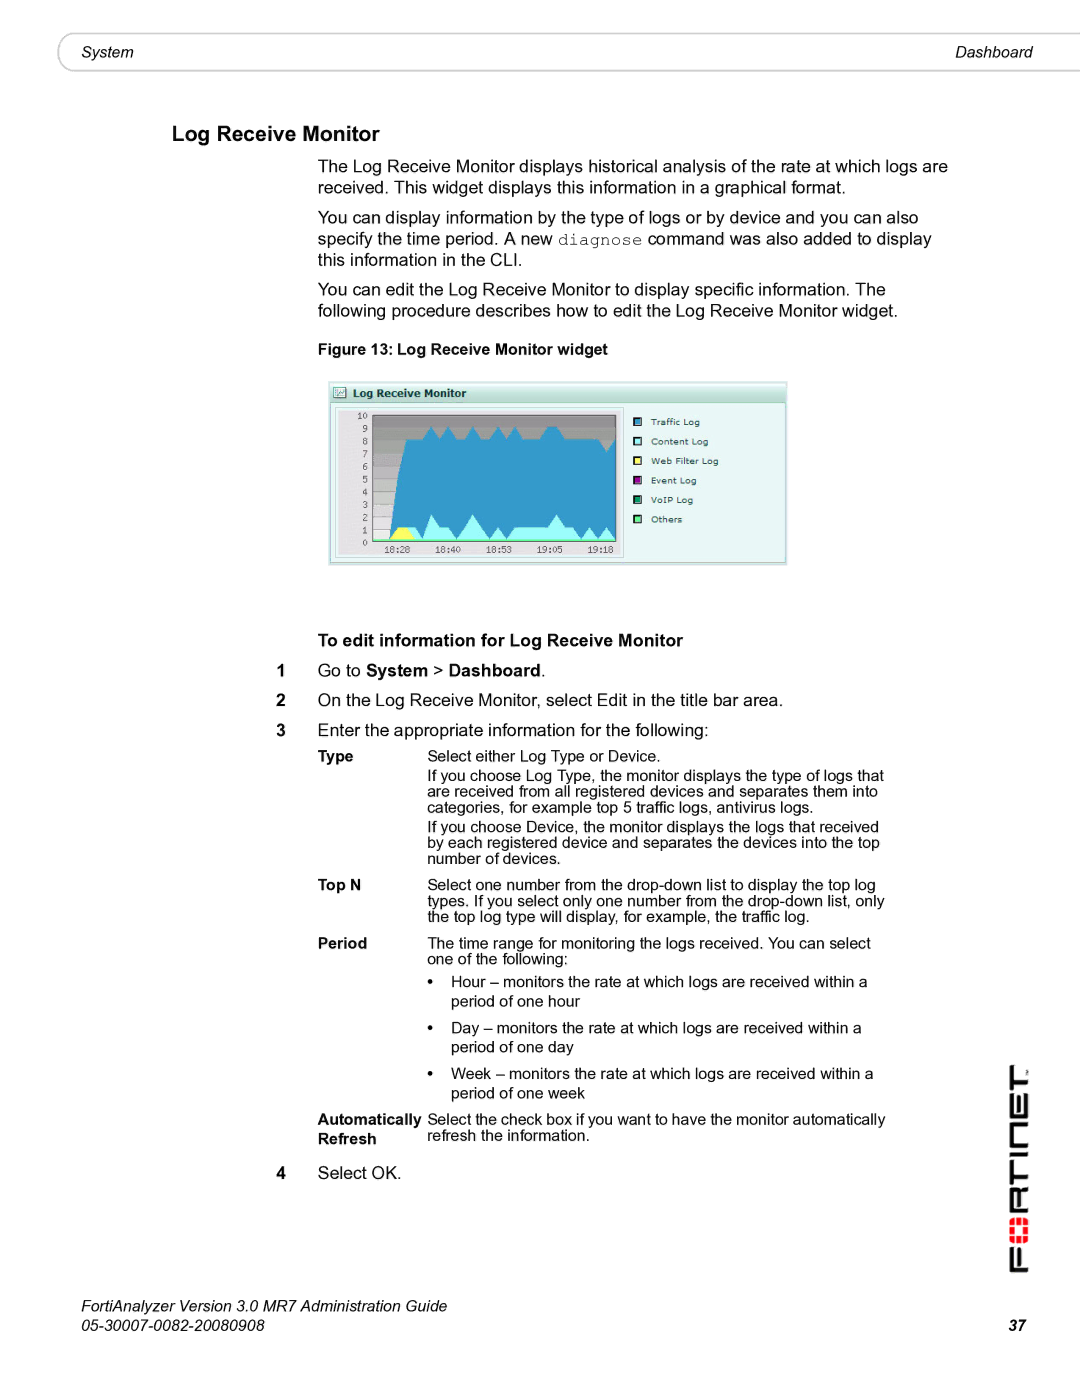
Type
Log Receive Monitor
Top N
Period
Virus Activity
Intrusion Activity
Display by
Virus Activity widget
Top FTP Traffic
Top Email Traffic, select Edit
Top Email Traffic
Top IM/P2P Traffic, select Edit in the title bar area
Top IM/P2P Traffic
To edit information for Top Traffic Go to System Dashboard
Top Traffic
Top Traffic, select Edit in the title bar area
Top Web Traffic, select Edit
Top Web Traffic
Interface
Network
Administrative
Changing interface settings
Status
Modify
About Fortinet Discovery Protocol
To configure DNS settings Go to System Network DNS
Routing
Enter an IP address for a primary and secondary DNS server
Select Create New Configure the following options
Admin
Adding a route
To add a static route Go to System Network Routing
Adding or editing an administrator account
Access Profile
Changing an administrator’s password
Access Profile
Admin Domain
Auth Group
To add a group Go to System Admin Auth Group
None
Read Only
To add a Radius server Go to System Admin Radius Server
Administrator Settings
Select Create New Configure the following and select OK
Radius Server
Monitor
Network Sharing
Adding share users
To add a user account Go to System Network Sharing User
Adding share groups
Configuring Windows shares
To add a user group Go to System Network Sharing Group
Permissions
Assigning user permissions
Remote Clients
Configuring NFS shares
Default file permissions on NFS shares
Config
Automatic file deletion and local log settings
Log Level Allocated Disk Space MB
FortiAnalyzer unit log settings Log Locally
Configuring log aggregation
FortiAnalyzer-800/800B
FortiAnalyzer-400
FortiAnalyzer-2000/2000A
FortiAnalyzer-4000/4000A
Configuring an aggregation server
Configuring an aggregation client
Configuring log forwarding
To forward log events Go to System Config Log Forwarding
To add an IP alias Go to System Config IP Alias
Configuring IP aliases
To edit an IP alias Go to System Config IP Alias
To import the alias file Go to System Config IP Alias
IP alias ranges
Configuring RAID
RAID levels
RAID
Linear
RAID 5 with hot spare
Hot swapping hard disks
FortiAnalyzer-800/800B disk drive configuration
FortiAnalyzer-400 disk drive configuration
FortiAnalyzer-2000/2000A disk drive configuration
To swap a hard disk Go to System Config RAID
FortiAnalyzer-4000 disk drive configuration
As well as from System Config RAID
Configuring RAID on the FortiAnalyzer-400
FortiAnalyzer-800/800B
Level 1
Size GB
Configuring Ldap connections
Select Create New. Complete the following
To define an Ldap server query Go to System Config Ldap
Backup & Restore
Maintenance
Backup Back up the current configuration
FortiGuard Center
10.10.1.108889
Scheduled
Update
Every
Daily
Maintenance
Viewing the device list
Device
Show
Add Device
Unregistered Device Options
Hardware
Action
Secure Connection Disk Space MB Used/Allocated
To delete a device Go to Device All Device
Maximum number of devices
Unregistered vs. registered devices
Configuring unregistered device connection attempt handling
Or the following options for unknown device types
Manually adding a device
Device ID
Device Name
Mode
Member IDs
Group Membership FortiGate Interface Specification
When Allocated Disk Space is All Used Devices Privileges
Classifying FortiGate network interfaces
For more information, see Manually adding a device on
Configure the FortiGate device
On the FortiAnalyzer unit, go to Device All
To enable the FortiAnalyzer unit to reply to FDP packets
Go to System Network
Hardware Model
Blocking device connection attempts
To block a device Go to Device All Device
Configuring device groups
To unblock a device Go to Device All Blocked Device
To delete a device group Go to Device Group Device Group
To configure a device group Go to Device Group Device Group
Group Name
Members
Viewing log messages
Log
Viewing current log messages
Viewing historical log messages
Column
Settings
To view historical logs Go to Log Log Viewer Historical
Browsing log files
Import
Viewing log file contents
To import a log file Go to Log Browse
Importing a log file
To download a whole log file Go to Log Browse
Downloading a log file
To download a partial log file Go to Log Browse
Convert to CSV format Compress with gzip
Customizing the log view
Select Download Current View Configure the following
Displaying and arranging log columns
To display logs in Raw or Formatted view
To display or hide columns
Filtering logs
To change the order of the columns
To disable a filter
To filter log messages by column contents
Filtering tips
101
Searching the logs
From
Searching the logs
To search the logs Go to Log Search
Search tips
103
Printing the search results
192.168.* action=login
Downloading the search results
To download log search results Go to Log Search
Rolling and uploading logs
105
Not exceeded
Exceed
Server IP address
Username
107
108
Viewing content archives
Content Archive
Printable Version Delete associated content archive files
View per page Page n of n Column Settings
Timeframe
109
Customizing the content archive view
Filter icons in the content logs
111
Searching full email content archives
113
Last activity
114
Reports
Configuring reports
Configuring report layout
Name Enter a name for the report Description
To configure a report layout Go to Report Config Layout
115
Header Logo
Title Page Logo
Category
117
Editing charts in a report layout
Maximum Entries Top N Time Scale Advanced
To edit a chart
To edit text
Configuring report schedules
To edit section
119
Schedule Name
To configure a report schedule Go to Report Schedule
Report layout Name
Schedule
Data Filter
Log Data Filtering
Time Period
121
Data filter templates
Configuring data filter templates
Sources
Filter logic
123
Interfaces
Destinations
Policy IDs
Day of the Week
125
Configuring report output templates
Output template
FTP/SFTP/SCP Server Action
127
Nomatch=No matching log data for this report
Configuring language
# Localization uses a Latin character set
Comment is
129
Font
Languages
Save the format file
Language file error messages Error message Description
131
Browsing reports
133
134
Viewing quarantined files
Quarantine
Quarantined files for a specific device
See
Date & Time
Service
Checksum
Status Description
Alert Events
Alert
Triggers
To add a new alert event Go to Alert Alert Event
Adding an alert event
Output
Configuring alerts by email server
To Email Address
Add
Configuring Snmp traps and alerts
Testing the mail server configuration
Enable
Smtp Server
137
FortiAnalyzer Snmp support
Adding an Snmp server
Fortinet MIB System Traps
Fortinet MIB Administrator Accounts
Fortinet MIB Logging Traps
Fortinet MIB VPN Traps
Adding a Syslog server
Configuring alerts by Syslog server
RFC-1213 MIB
RFC-2665 Ethernet-like MIB
141
Configure the following options, and select OK
142
Network Analyzer
Config log settings Set enableanalyzer yes End
Example network topology for Network Analyzer use
Viewing current Network Analyzer log messages
Viewing Network Analyzer log messages
143
Viewing historical Network Analyzer log messages
Protocol Protocol used when sending the traffic Message
Browsing Network Analyzer log files
Viewing Network Analyzer log file contents
Printable Version Download Current View
Resolve Service View n per page Page n of n Column Settings
147
Downloading a Network Analyzer log file
Displaying and arranging Network Analyzer log columns
Customizing the Network Analyzer log view
149
Filter icons in Network Analyzer
150
Keywords
Searching the Network Analyzer logs
Quick Search
Full Search
Other
To search the logs Go to Tools Network Analyzer Search
153
172.20.120.127 tcp
Select the download options that you want, then select OK
Rolling and uploading Network Analyzer logs
155
Log file should be rolled... even if size is not exceeded
Select the protocol to use when uploading to the server
Preparing for the vulnerability scan job
Tools
157
Preparing Windows target hosts
159
To enable NetBIOS Go to Start Control Panel
Preparing Unix target hosts
Viewing vulnerability scan modules
161
Vulnerability Scan modules View modules with severity
Details
Configuring vulnerability scan jobs
163
Target
Job Name
Select Create New Complete the following
Remote Authentication User Name
Scan Targets
Quick Scan
Email Attachment
File output
Email Body
167
Viewing vulnerability scan reports
End Time
File Explorer
Formats
169
File Explorer with Storage directory expanded
170
Managing firmware versions
Backing up your configuration
Backing up your configuration using the CLI
Backing up your configuration using the web-based manager
To back up your configuration file using the CLI
Execute backup config filename addressip passwd
171
Press any key to display configuration menu…
Testing firmware before upgrading
To test the firmware image before upgrading
Enter Local Address
Enter Tftp server address
Enter firmware image file name image.out
173
Upgrading your FortiAnalyzer unit
Upgrading using the web-based manager
Upgrading to FortiAnalyzer
Only
To upgrade to FortiAnalyzer 3.0 using the web-based manager
Upgrading using the CLI
To upgrade to FortiAnalyzer 3.0 using the CLI
Execute restore image namestr tftpip4
Get system status
Verifying the upgrade
Downgrading to FortiLog
Reverting to a previous firmware version
Select OK Following message appears
177
To downgrade using the CLI
Downgrading to FortiLog 1.6 using the CLI
Execute restore image tftp namestr tftpipv4
Execute restore image tftp image.out
179
Restoring configuration settings on a FortiAnalyzer unit
Restoring your configuration
To restore a firmware image to the FortiAnalyzer unit
Execute reboot
Press any key to display configuration menu
When this message appears
Enter File Name image.out
181
To restore configuration settings using the CLI
Restoring your configuration settings using the CLI
Execute restore config namestr tftpipv4 passwrd
Execute restore config confall 192.168.1.168 ghrffdt123
183
184
FortiGate reports
Appendix FortiAnalyzer reports in 3.0 MR7
185
Intrusion Activity reports MR6 reports MR7 reports
Antivirus Activity
Antivirus Activity reports MR6 reports MR7 reports
187
Antivirus Activity reports
Top Virus Destinations over POP3
WebFilter Activity reports MR6 reports MR7 reports
Webfilter Activity
189
WebFilter Activity reports
Antispam Activity
Antispam Activity reports MR6 reports MR7 reports
Antispam Activity reports
IM Activity
IM reports MR6 reports MR7 reports
191
VoIP reports MR7 reports
IM reports
VoIP reports
Content Activity
193
Network Activity
Content Activity reports MR6 reports MR7 reports
Network Activity reports MR6 reports MR7 reports
Network Activity reports
Web Activity
195
FTP Activity
Mail Activity
Report, Top Mail Servers Connections remains unchanged
VPN Activity
Terminal Activity
FTP Activity reports
Terminal Activity reports MR6 reports MR7 reports
VPN Activity reports MR6 reports MR7 reports
Event Activity
Event Activity reports MR6 reports MR7 reports
Report, Top Event Categories by Status, was removed
P2P Activity
Event Activity reports
P2P Activity reports MR6 reports MR7 reports
P2P Activity reports
Audit Activity
201
Summary Reports
Audit
Forensic Reports
Detailed
Report, Top Client Requests to Permitted Sites, was removed
Summary
FortiMail Reports
Mail High Level
203
Mail High Level reports
Mail Sender reports MR6 reports MR7 reports
Mail Sender
205
Mail Destination IP
Mail Recipient Activity
Mail Sender reports
Mail Recipient Activity reports MR6 reports MR7 reports
Mail Destination IP reports MR6 reports MR7 reports
Spam Sender
Spam Sender reports MR6 reports MR7 reports
207
Spam Sender reports
Spam Recipient
Spam Recipient reports MR6 reports MR7 reports
Virus Sender
Spam Destination IP
Spam Recipient reports
Spam Destination IP reports MR6 reports MR7 reports
Virus Sender reports MR6 reports MR7 reports
Virus Sender reports
Virus Recipient
Virus Recipient reports MR6 reports MR7 reports
211
Virus Destination IP
FortiClient Reports
213
Index
FDN
215
FTP
Mail server 135 Main Menu 20 managing firmware
217
RFC
See also protocol test
219
Index FortiAnalyzer Version 3.0 MR7 Administration Guide