Gpsmap 695/696
Page
Page
Page
Fax 886/02.2642.9099
Tel 913/397.8200 Fax 913/397.8282
Tel 886/02.2642.9199
July 190-00919-00 Rev. F
190-00919-00 Rev. F
190-00919-00 Rev. F
190-00919-00 Rev. F
190-00919-00 Rev. F
System Software Version 2.20-2.30 changes
Change Summary
Description
March, System Software Version 2.00 2.20 changes
System Software Version 4.80-4.90 changes
Rev Date
March, System Software Version 4.40-4.50 changes
System Software Version 4.70-4.80 changes
Added GDL 39 support RR-12
July, 2012 System Software Version 4.90-5.00 changes
System Software Version 5.00-6.00 changes
Table of Contents
Table of Contents
176
149
165
167
243
217
221
237
Unit Overview
Unit Overview
Additional Non-user-replaceable Battery Warnings
Battery Care and Charging
Battery Warnings
Additional User-replaceable Battery Warnings
Using charge mode
INSERTING/REMOVING the Battery Pack
Charging the Battery Pack
Charging the unit’s battery pack
Turning the Unit ON/OFF
Press and hold the Power Button to turn the unit on or off
Adjusting Backlighting on Power up
Data link Weather Advisory
Press the ENT Key to acknowledge this information
Database Initialization
2D or 3D fix
GPS Receiver Status
Satellite Information
Acquiring Satellites
FMS
Power Press and hold to turn the unit on or off
Gpsmap 695/696 Controls
Button
Selection Keys
Key
Navigating the Main Menu
Accessing System Functionality
Menus
Navigating the Page Menu
Main Menu
Data Entry
Data Entry
Using the FMS Joystick to enter data
Waypoint Entry Waypoint
Pages
Selecting a Main Page using the FMS Joystick
Main Pages
Traffic Page TRF
Selecting the FPL or Nrst Pages
FPL and Nrst Pages
Nearest Pages contain the following information
Nearest Intersections INT
Nearest Pages Nrst
Nearest Airports APT
Nearest Cities CTY
Flight Plan List List
Main Menu Pages
Flight Planning Pages FPL
Active Flight Plan Actv
Main page Softkeys
System Setup Pages
System Setup pages are accessed from the Main Menu
Selecting the system setup pages
IFR MAP Softkey selected
MAP page Softkeys
Terrain page Softkeys
Waypoint page Softkeys
Stations
ALT Mode Softkey selected
Select to view Data Link and Weather info
Above and 9900 feet below the aircraft
Highlights the Category field
Siriusxm Audio page Softkeys Optional
Info page Softkey
Displays SiriusXM Information
Active Flight Plan page Softkeys
Flight Planning Softkeys
Displays/removes the nearest heliports
Nearest page Softkeys
Nearest Airport page Softkeys
Exits the Nearest Pages
Display
System Settings
Units Alarms Date & Time Power
Restoring system setting defaults
Display
Manually adjusted
Adjusting display backlighting
Restore Default Window
Display Setup
Backlight Timeout
Adjusting backlight timeout
Screenshots
Aircraft Position on MAP/CHARTS
Sound
Units
Changing display unit settings
Sound Setup
Units Setup
Date & Time
Changing date & time settings
Changing position settings
Date & Time Setup
Position Setup
Alarms
Changing interface settings
Changing alarm settings
Alarms
Power
Turning the power loss warning on/off
Nearest Airports Page Menu
Setting Airport Criteria
Entering airport criteria
Airport Criteria Window
To restore airport criteria defaults
Utilities
Data Bar Fields and HSI
Introduction
Layout
Map Only Map with Panel Data Bar Fields
Data Bar Field Selection
Data BAR Fields
Changing the information shown in the data bar fields
Data Bar Fields
Glide Ratio Glide Ratio Ground Speed GS Ground Track TRK
Flight Timer FLT Timer
Estimated Time of Arrival
Time
Layout Window Map
Compass ARC
Changing page layout
Compass Arc Map
Removing the Compass Arc from the Map
Panel
Changing the CDI scale
Changing the CDI Scale
CDI scale = 5.0 if the previous two conditions do not exist
CDI scale can be set from the Map Page Menu
Setting the Bug Indicator
Setting the BUG Indicator
Manually Setting a Course
Bug Indicator can be set from the Map Page Menu
Returning to automatic sequencing of route waypoints
Vertical Navigation Vnav
Visual Representation of Vnav
Using the Vnav Feature
Configuring a Vnav profile
Enter a valid Vnav profile and begin navigation
Enabling/disabling the Vnav indicator
Capturing/cancelling Vnav profile
Profile-Enter the descent rate
Vnav Indicator Panel
Using MAP Displays
Changing the Navigation Map orientation
MAP Orientation
MAP Range
Map Range/Overzoom
MAP Panning
Auto Zoom
Enabling/disabling autozoom
Map Panning Map
Panning the map
Measuring bearing and distance between any two points
Reviewing information for a map or weather feature
Measuring Bearing and Distance
Topographic Data Map
Topography
Displaying/removing topographic data
Satellite View Map
Satellite View
Satellite View displays satellite imagery above 20nm
Displaying/removing satellite imagery on the map
MAP Detail
MAP Symbols
Adjusting the map detail
MAP Declutter
Runway Extensions and Numbers Map
Setting up and customizing airports and NAVAIDs for the map
Airports & Navaids
Cities & Roads
Setting up and customizing cities and roads for the map
Map Setup Page City Category
Airways
Setting up and customizing airspace for the map
Airspace
Reviewing information for an airway
Displaying/removing airways
Select the MAP Softkey on the Map
Low Altitude Airway Review
Press the ENT Key to display the review page for the airway
Reviewing Airway Information Map
Waypoint WPT Page provides airport and waypoint information
Waypoints
Waypoint Page Info Softkey Selected
Press the ENT Key
Runways Box Waypoint
Selecting a runway
Waypoint Information Window-Duplicate Identifier
Viewing additional information for a frequency
Frequencies
Viewing nearest information
Nearest Information
Press the ENT Key to view the Additional Information Window
Nearest Airports
Setting nearest airport criteria
Nearest Airport Criteria
Selecting airport weather information
Restoring nearest airport criteria defaults
Weather Information
Nearest Airport Weather
Press the Nrst Key
Select an NDB
Intersections
Ndbs
Select an intersection
Select an VOR
Vors
Main Menu User Waypoints Selected
User Waypoints
Creating user waypoints
New Waypoint Window Symbol Selected
Editing or renaming a user waypoint
With ‘Done’ highlighted, press the ENT Key
Selecting and viewing nearest user waypoints
User Waypoints Page Menu
Deleting user waypoints
Select ‘Delete Waypoint’ or ‘Delete All’
Highlight ‘Yes’ and press the ENT Key
Nearest Airspace
Airspace
Selecting and viewing nearest airspaces
Press the ENT Key to display the Airspace Information
Inside Airspace-Within the boundaries of the airspace
Airspace Alert Messages
Smart Airspace
There are four types of status information
Direct-to Window
DIRECT-TO Navigation
Flight Plan Waypoints Direct-to Window
Selecting a nearby airport as a direct-to destination
Cancelling a direct-to
Changing the information shown in the data fields
Data Fields
Data Field Selection Active Flight Plan
Active Flight Plan
Flight Plan Creation
Insert Waypoint Window
Creating an active flight plan
Creating a stored flight plan
Adding a waypoint to a stored flight plan
Adding Waypoints to AN Existing Flight Plan
Adding a waypoint to the active flight plan
Loading an approach procedure into a stored flight plan
Graphical Flight Plan Window
Graphical Flight Planning
Graphical Flight Plan Creation
Graphical Flight Plan Editing
Adding Flight Plan Waypoints Graphically
Press the FPL Key
Removing Flight Plan Waypoints Graphically
Flight Plan Page Waypoint Selected with Map Pointer
Flight Plan List
Flight Plan Storage
Viewing information about a stored flight plan
Activating a Flight Plan Leg
Flight Plan Activation
Storing an active flight plan from the Active Flight Plan
Activating a stored flight plan
Activate Leg Window
Adjusting the Active Flight Plan fuel flow
Editing Speed and Fuel Flow
Select the desired aircraft or create a new one
Fuel Flow Active Flight Plan
Adjusting the Saved Flight Plan speed and fuel flow
Move the FMS Joystick to the ‘Plan Speed’ field
Deleting a stored flight plan
Copying Flight Plans
Deleting Flight Plans
Copying a stored flight plan
Active Flight Plan Page Menu
Deleting all stored flight plans
Deleting the Active Flight Plan
Deleting an individual waypoint from a saved flight plan
Inverting a Flight Plan
Deleting an individual waypoint from the active flight plan
Press the FPL Key to display the Active Flight Plan
Exporting flight plans
IMPORTING/EXPORTING Flight Plans
Inverting a saved flight plan
Importing flight plans
Select Approach Window
Approaches
Select Approach Menu
Viewing a chart for the selected approach
Selecting AN Approach
Loading an approach from the active or saved flight plan
With ‘Yes’ highlighted, press the ENT Key
Activating an approach on the Active Flight Plan
Removing an approach
Vectors-to-Final Active Flight Plan
Activating VECTORS-TO-FINAL
101
Cancelling Vectors-to-Final
Trip Planning
Blank
103
Switching Weather Sources
Weather Information
Weather Source
Siriusxm Weather 696 only
Activating Services
From the Weather Page press Setup Softkey
Accessing SiriusXM Weather information
105
Nexrad
Nexrad Abnormalities
Radar Legend
Nexrad Limitations
107
Satellite Mosaic
Echo Tops
Echo Tops Data
Winds Aloft
109
Surface Pressure
Other Legend
Lightning Data
Storm Cell Data
Storm Cells
111
Changing Metar and TAF text
Metar Legend
Sigmets
Airmets
113
Temporary Flight Restrictions TFR
TFR Data
Freezing Level Data
Freezing Levels
Pirep Data on Weather
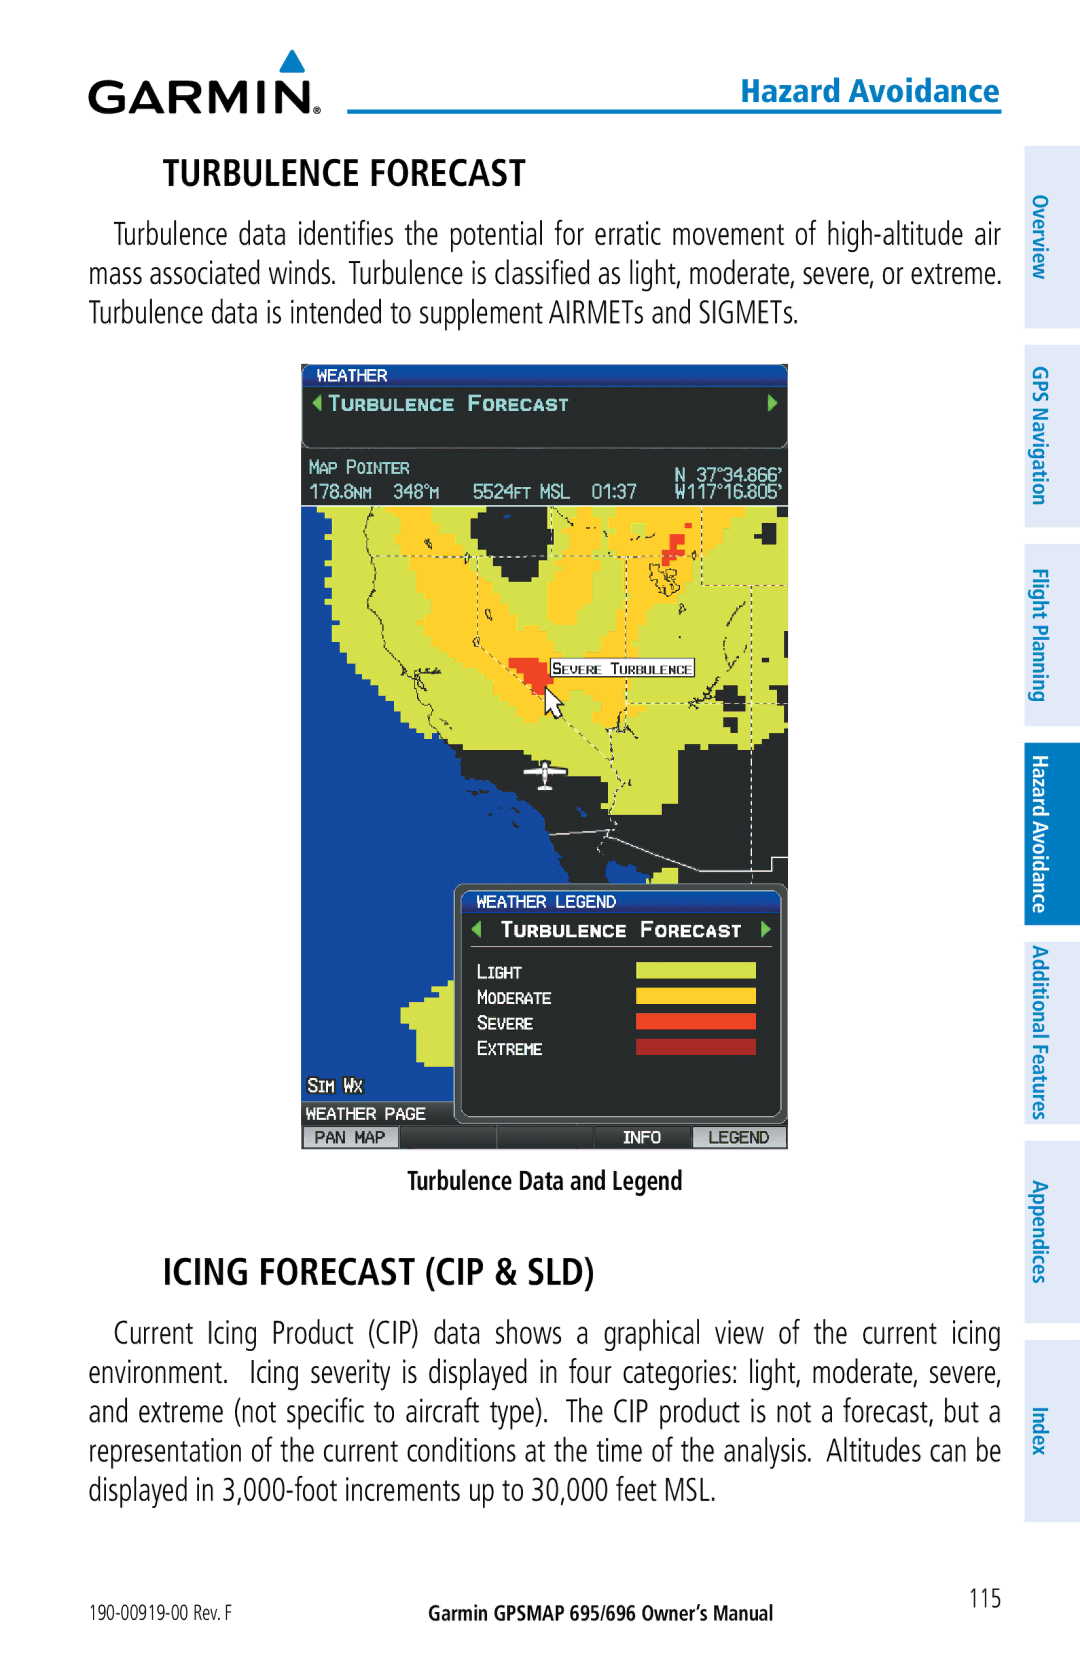
115
Turbulence Forecast
Icing Forecast CIP & SLD
Turbulence Data and Legend
Icing Forecast Data and Legend
117
Forecast
Forecast Data
Fronts Legend
Sea Temperature Data and Legend
SEA Surface Temperature
119
SIGMETs TFRs AIRMETs
Viewing SiriusXM Weather products on the Weather WX
Forecast
Viewing SiriusXM Weather products on the Map
121
Setting up and customizing weather data for the Map
Viewing legends for displayed weather products
Restoring default weather data for the Map
123
Animating SiriusXM Weather
Data Link Weather FIS-B
125
FIS-B Weather Products
Viewing FIS-B Product Status
Viewing Ground Station Status
Broadcast
Update Interval
Expiration
Weather Product Timing
Temperatures Aloft
Winds
Including TFRs
Nexrad Abnormalities
129
FIS-B Radar Products
FIS-B Radar Combined
FIS-B Radar Conus
131
Winds Aloft
Temperatures Aloft
Temperatures Aloft
133
Metars and Tafs
AIRMET/SIGMET Legend
135
Temporary Flight Restrictions TFR
Pirep Data
Pireps
137
Using FIS-B Weather Products
Viewing FIS-B Weather products on the Weather WX
Viewing FIS-B Weather products on the Map
139
Animating FIS-B weather
141
Viewing FIS-B NOTAMs
Notams Information
Will change as ground track changes
Terrain
Obstacle Information
Terrain Information
Enabling/Disabling Terrain Shading on the Map
Terrain Settings
Terrain and Obstacle Color Code
145
Accessing the terrain settings
Terrain Setup
Setting up the Terrain
Enabling/Disabling terrain alerts
From the Terrain Page, press the Disable Softkey
Terrain Alerts
Aural Alerts
Pull up
Alert Terrain
Enabling/Disabling Terrain Audio
Severity
Transponder
Traffic Information
Traffic Source
Traffic Source
System Status
Traffic Information Service TIS-A
TIS-A Symbology
System Status
Traffic-TIS-A traffic alert received
TIS-A Symbol
Adjusting alert volume
TIS-A Alerts
TIS-A traffic can be displayed on the Map
Setting up and customizing TIS-A traffic on the map
Traffic Warning Window
Traffic Ground Track
153
Displaying TIS-A information using the Map Pointer
TIS-A Map
ADS-B System
Data Link Traffic GDL
155
Viewing GDL 39 Traffic and Weather Status
157
Operating TIS-A/TAS No Traffic Data Available from TIS-A
Traffic Description
Symbol Description
Altitude Look Ahead Vertical Horizontal Geodetic
Disabling/Enabling the traffic alerts
Traffic Alerts ADS-B TIS-B
Traffic-TIS-B/ADS-B traffic alert received
161
Displaying Traffic information using the map pointer
Displaying Traffic Data
Enabling/disabling traffic data on the Map
Traffic Map
Dedicated Traffic page TRF
Displaying/Removing the Traffic
Changing the altitude range
Example ADS-B Traffic Symbol
Flight ID Display and Ground Track
Enabling/Disabling Flight ID Display
Traffic
Safetaxi
Unit Feature
ChartView FliteCharts SafeTaxi SiriusXM
Additional Features
SafeTaxi Depiction on the Map
Enabling/disabling SafeTaxi
Safetaxi Cycle Number and Revision
Chartview Optional
Move the FMS Joystick to highlight the Chart Field
Departure Procedures DP NOTAMs Approaches
Displaying ChartView
Aircraft Symbol Displayed on Chart Waypoint
Aircraft Symbol
Showing/Hiding the aircraft symbol on the chart
Chart Not Available Banner
Jeppesen DATABASE-PUBLISHED Notams
Chart Range
Changing the chart range
Drop-down Chart Menu
Displaying FliteCharts
Flitecharts
Departure Procedures DP
Airport Diagrams
172
173
FliteCharts Waypoint WPT
Aircraft Not Shown Icon Waypoint
FliteCharts Zoomed Out
Flitecharts Cycle Number and Expiration Date
Icon
Airport Directory Data
Viewing Airport Directory information
Press the Aopa or Directory Softkey
177
From the XM Audio Page press the Info Softkey
Accessing the Radio ID
XM Information
Selecting the XM Audio
Category Field
Category
Selecting a category
Turn the FMS Joystick to highlight the desired category. Or
Now Playing Box
Active Channel and Channel List
Selecting a channel
Active Channel
Adding a Channel to Favorites
Using Favorites
To add a channel to Favorites
Selecting Favorites
To delete a channel from Favorites
Volume
Radio volume is shown in the Now Playing Box
Adjusting the volume
Showing/Hiding the XM Audio
Electronic Checklists
SHOW/HIDE the XM Audio
XM Audio and WX Pages can be hidden from view
185
Flight Data Logging
186
MESSAGES, Alerts & Data Field Options System Messages
Proximity Memory Full
No XM Signal
SiriusXM signal
Message Comments Next DTK
Terrain
Traffic
Data Field Options
Destination ETE Dest
Flight Timer FLT Timer
Data Field Option Definition
Estimated Time En Route
Time of Day Time
Sunrise
Sunset
Time UTC
Abnormal Operation
Resetting the Unit
To reset the unit
Remove the power source and restart the unit
Terrain Page Red
Hazard Display with Loss of GPS Position
Mapsource Detailed Maps
Installing and Removing SD Cards
SD Card USE and Databases
SD Card USE
Removing an SD Card
Installing an SD Card
Gpsmap 695/696 Databases
Database
FliteCharts SafeTaxi Obstacle Terrain
Basemap
Airport Directory Databases
Navigation Database
ARTCC-Air Route Traffic Control Centers
Obstacle
Flitecharts
Chartview Optional
Safetaxi
Select ‘Database Information’ and press the ENT Key
System Setup
Updating Gpsmap 695/696 Databases
Obtaining the Unit ID
201
Equipment required to perform the update
Updating Gpsmap 695/696 Databases
Database Information
Update Databases Database Status Updated
Update Databases
Exporting User Waypoints
Exporting a track log
204
Power/Data Connector on the Gpsmap 695/696 Unit
Bare Wire Power/Data Cable for the Gpsmap 695/696 Unit
Connecting to a Garmin VHF Comm Radio
Gpsmap 695/696 and Power/Data Connector
Nearest VOR frequencies SL30 only
Connecting to a Computer
Following features are now available on the radio
Information about USB Drivers
Connecting the GXM 40 antenna
GXM 40 Antenna
Connecting to a GDL
GDL 39 Power/Data Cable to Gpsmap 695/696
Connection
GDL 39 Configuration
211
Configuring Gpsmap 695/696 for GDL
GDL 39 Interface Setup
212
Selecting an interface
General Interface Setup
Interface Setup Main Menu Serial Data Formats
Garmin GDL 39, or another Garmin Gpsmap 695/696
Nmea Sentence Output
Setting Nmea output mode
Advanced Nmea Output Setup
Gpsmap 695/696 MCX Connector
Pgrmh Fast Mode GPRMB, GPRMC, PGRMZ, and Pgrmh
Configuring TIS-A input
TIS-A Interface Setup
216
TIS-A VS. TAS/TCAS
General TIS-A Information
TIS-A Limitations
Terminal Mode S radar site map
219
220
Viewing details for a flight
Utilities
Flight LOG
Viewing the Flight LOG
Flight Log List Flight Log Review
Track Log Map
Track LOG
Deleting Flight Records
Deleting flight records
Displaying/removing the track log on the Map
Save feature allows storage of up to 15 track logs
Changing track log settings
225
Clearing the track log
Saving a track log
Track Log Window
Editing a track log
Heading Line
227
Changing the heading line settings on the Map
Heading Line Map Setup Page Menu
E6B Calculator
Accessing the E6B calculator
E6B Calculator
Press the Menu Key twice to open the Main Menu
229
Calculating true airspeed and density altitude
Calculating winds aloft
Aircraft Profile
Restoring E6B calculator defaults
Accessing the aircraft profile
Deleting a saved aircraft profile
Entering an aircraft profile
Selecting a saved aircraft profile
Renaming a saved aircraft profile
To perform weight and balance calculations
Weight & Balance
EPE Circle
Setting up and customizing the EPE circle for the map
Weight & Balance
Defining proximity waypoints
Setting up and customizing proximity waypoints for the map
Proximity Waypoint Alarm
Proximity Waypoints
235
Deleting proximity waypoints
236
Americas/Pacific Database Airports
Display Symbols
VFR Symbols
IFR Symbols
VFR, Paved, Private
Beacon VFR Airport, Serviced
IFR Airport, Serviced
Unknown Intersection
Airspace Symbols
241
Symbol
Training Area Restricted
Prohibited, or Training Area
242
Location Formats
MAP Datums
244
Glossary
DBZ Decibels ‘Z’ radar return Deg Degree Desired Track
Course to Steer
Along the flight plan
Direction, left or right
Federal Communication Commission
Federal Aviation Administration
Flight Service Station
Final Approach Fix
Hertz
Horizontal Situation Indicator
Indicated Air Temperature
Hour
Military Operations Area
Outside Air Temperature
MHz Megahertz Minimum Safe
Altitude Miles of the aircraft present position
Volume
Traffic Information Service
Traffic Information Service-Broadcast
Terminal Radar Service Area
Contact Garmin Software License Agreement
Limited Warranty
AC-U-KWIK License Agreement
Aopa Airport Directory Notice
User Safety
Weather Data Warranty
Industry Canada Compliance
FCC Compliance
AC-U-KWIK 176, 196
Chart Not Available 169
978 MHz
170 1090 MHz Compass Arc
Orientation
Map Symbols
155 Map
221 Detail
Weight & Balance
217-218 Power
Reset
Symbols
Index-4
Page
886/2.2642.9199 886/2.2642.9099