HP Part Number NW239-90001 Edition 1, May
HP 10bII+ Financial Calculator User’s Guide
Legal Notice
HP 10bII+ Financial Calculator
Number
Keyboard Map Legend
Table of Contents
Page
Page
III
JGD
At a Glance
Basics of Key Functions
Boxed Key Functions
Shift Keys
Add 15% to
Jj7V1
JV§4
Percentages
Memory Keys
JVÀ
GG¼
DDÃ
GG4
GV4
J7GV
Time Value of Money TVM
JG\Í
DSÙ
JYÏ
How much can you borrow at a 9.5% interest rate?
JyÌ
D7VÒ
TVM What if
Jæjg
Amortization
Amortize the 1 st through 24 th loan payments
Depreciation
Interest Rate Conversion
Cash Flows, IRR/YR, NPV, and NFV
\½\«
GD¤
Yy¤
Yj¤
JÆG¤
G7GgGJ
VG4
Date and Calendar
Bonds
S7jVÎ
Y7jVÔ
For more information on bond calculations, refer to , Bonds
Break-even
\e \«
\k \«
\T \«
\h \«
\T\«
GÆV¡
YÆd¡
SÆJS¡
Probability
\5V
7VF
17GV4
7SG
Trigonometric Functions
Find Sin θ =.62 in degrees. If RAD is displayed, press
\aJg
Convert the results to radians using Pi
At a Glance
Displayed text
Power On and Off
Getting Started
Manual Conventions and Examples
Item before the / is the alternate
Shift Keys
Operating Modes
GY7jJ1SG7Yj4
JdPJG7Sg4
Simple Arithmetic Calculations
7dJ4
Calculations in Chain Mode
1JJV7V4
S7dPV7DVa
JG\n
Calculations in Algebraic Mode
Using Parentheses in Calculations
Da\qgVA
Clearing the Calculator
JVy
AD4
Understanding the Display and Keyboard Cursor
Annunciators
Clear All
Clearing Messages
INV
Same as pressing
Input Key
Swap Key
Statistics Keys
One-Number Functions
Gd7GV\B
D7Vj1G7DS\b
Math Functions
Getting Started
7DVoR
\5Y
JVc
J1SC
PY7V\2
A7SGoR
\5G
YP\
In-line Functions
J7GVrc
17VdrC
Two-Number Functions
Gd1DD
Jj\¨
JjÆ
Gd\¨
-23below lists the two-number functions of the calculator
Arithmetic with One-and Two-number Functions
JGV\QD4
G7V\K
Last Answer
VAJ7GV4
\Qv4
GG1JY\¨
Specifying Displayed Decimal Places
\5D
YV7SP
7JGVS4
Jaj4
\54
\zyJG
Messages
D7gjSVYD
Percent key
GV§
Business Percentages
Business Percentage Keys
Jgpvæ
JGV1j§
GdJ7j\¨
DJS7g4
Margin Calculations
Gvvà
JdÀ
Margin and Markup Calculations
Using Margin and Markup Together
D7SÀ
JVÃ
Number Storage and Storage Register Arithmetic
Using Stored Numbers in Calculations
Using Constants
V1Gª
Example Calculate 23
J1J§ª
\QDª
Example Calculate 10 + 10%, 11 + 10%, and 25 + 10%
Using the M Register
VV\¨DGª
YV4
JS7dVm
Using Numbered Registers
Jjs
JY7GVm
V7Y
YjV7S
\w7Y ADd7JV \wG
VS7J1
YV7j \wD
G7V
\wPD
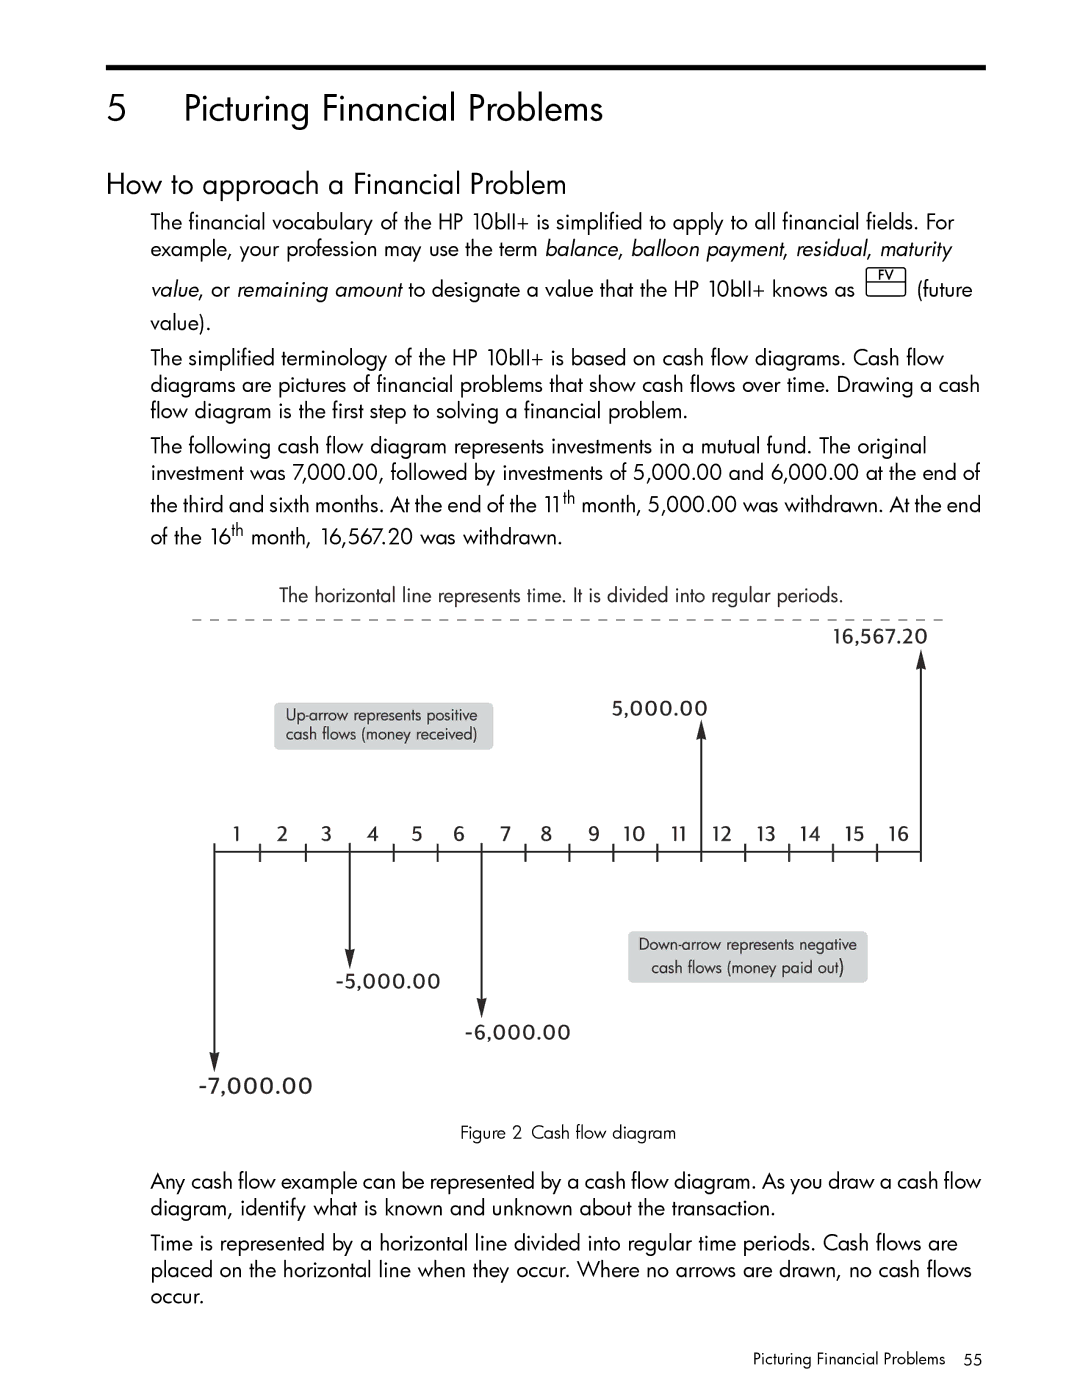
How to approach a Financial Problem
Picturing Financial Problems
Simple Interest
Signs of Cash Flows
Periods and Cash Flows
Simple and Compound Interest
Compound Interest
Interest Rates
Recognizing a TVM Problem
Two Types of Financial Problems
Cash flow diagram Borrower’s perspective
Recognizing a Cash Flow Problem
Cash flow diagram Investment in a mutual fund
Using the TVM Application
Time Value of Money Calculations
TVM Keys
Loan Calculations
Begin and End Modes
JVÏ
Dpjgù
J7VÒ
Jyva
1VÌ
DjVyÌ
1JV4
J7VÒ
DDyÌ
1JG4
GV\Ú
JjGVÏ
G7gÒ
YgÙ
1vÌ4
Savings Calculations
J7GÒ
GyÏ
GyÌ
GY\Í
S7DÒ
JV\Ú
YyÏ
Lease Calculations
Cash flow diagram Calculate the monthly lease payment
JVÉ
Cash flow diagram Calculate PV of the lease
Step Find the present value of the buy option
YjÙ
GYyÌ
1vÌy4
JVyÉ
1p4
Step Add the results of ’ ’ and ’ ’
Amort key on the HP 10bII+ allows you to calculate
To Amortize
J7jVÒ
Jdægy
JJ7VÒ
Jygvï
GVÆ
VYÆ
Amortize the 1st, 25th, and 54th payments
First Bank
S7j\Ó
Interest Rate Conversions
Investments With Different Compounding Periods
Compounding and Payment Periods Differ
S7SV\Ó
S7SD\Ó
DS\Í
GVyÌ
DSV\Í
Resetting the TVM Keys
Depreciation Keys
Depreciation
Item in the selected format
Inputs 5 for the expected useful life
Depreciation example using Declining Balance Keys
Cash Flow Calculations
How to Use the Cash Flow Application
Number1 ¤
Clearing the Cash Flow Memory
Cash Flow Calculations
Vy¤
Gy¤
Calculating Internal Rate of Return
Organizing Cash Flows
JJjSV7Gd¤
AJG
NPV and IRR/YR Discounting Cash Flows
Initial cash flow and cash flow groups
JJy¤
Viewing and Editing Cash Flows
11GÆ
JVÆ1GÆ
1JGyÆ1G
Calculating Net Present Value and Net Future Value
ÆY¤
VÆJ¤
VÆG¤
JVÒ
JVÆJ¤
Æd¤
JÆJ¤
Automatic Storage of IRR/YR and NPV
Cash flow diagram Calculates NPV
Calendar Formats and Date Calculations
Calendar Format
Date Format
Using the Input key
Date Calculation
Date Calculations and Number of Days
ÆJ\Ç
To enter the data for this example using the Ækey
JG7JgGJJ
\ÇJ4
J7JjGJG
\5S
Y7SGJ\Ä
DJ7JGJ4
Using the Ækey
J7JjGJGÆ
S7YGJV\Ä
Bond Keys
Bonds
Y7GgGJ
JJÑ
S7YGG
V7VÎ
JYË
Resetting the bond keys
J7JVGG
Y7JVGJG
Break-even Keys
Break-even
Break-even example
Calculating the projected maximum fixed cost
Resetting the Break-even keys
\Z\«
\k\«
\h\«
\e\«
Entering Statistical Data
Clearing Statistical Data
One-Variable Statistics
Two-Variable Statistics and Weighted Mean
Viewing and Editing Statistical Data
DGÆYJV¡
DVÆVJV¡
YD\W\5G
YDÆJGD¡
DjÆSgV¡
YV\W
Summary of Statistical Calculations
D7jV¡
Y7V¡
D7GV¡
D7V¡
JgVÆjj¡
JdDÆd¡
JgGÆgJ¡
JjjÆgD¡
400
VÆGgd¡
GÆJY¡
JÆdG¡
DÆJJ¡ VÆGGSV¡
Weighted Mean
VJSÆdG¡
VÆVY¡
VVÆDG¡
VJÆgg¡
Probability Calculations
Factorial
Permutations
VÆD9
VD4
VÆD
V9D4
Advanced Probability Distributions
YG\w6
Normal Lower Tail Probability
J7jyF
Inverse of Normal Lower Tail Probability
7GVoF
GIJ7gSy4
GÆJ7gSyI
Students T Probability Lower Tail
GSoI7V4
GSÆ7VoI
Inverse of Student’s t Probability Lower Tail
Conversions from Lower Tail
Y1J4
PG4
J7GyF
Returns desired value of z
Statistical Calculations
Business Applications
Setting a Sales Price
\qJ1\q GaJ4
Additional Examples
YÆJSjV¡ VÆGVd¡
JÆJ¡
GÆJJGJ¡
DÆJDS¡
YVsPJ§
Gpdspj
\q\qJ AG\n
\qDA
Jg§
AJPJ4
YVjG7gy
Yield of a Discounted or Premium Mortgage
Annual Percentage Rate for a Loan With Fees
VÙAYGÙ
JdyÏ
G7VÒ
AD§Ï
JSÏ
AG§Ï
JGÒ
1YVÏ
AJGP
JSaDP
YV\Ǥ4
Jjvï
Jgvï
D7VÒ
PvÙ4
Canadian Mortgages
JG\Ó
JDÏ
ÉD\Ú
JJ7GÒ
DVVVyÌ
What if … TVM Calculations
Savings
GS\Í
PvÙ1
VÏ4
Stores effective rate as annual
Gains That Go Untaxed Until Withdrawal
Jyyù
DVÙ
PJV§4
Yòìï
Wrap-Around Mortgages
G7JjVAGg
DyÌ
Cash Flow Examples
GGVJ7GG
Cash flow diagram Wrap-around mortgage
VÌy¤
DVy¤
VÌyAjVY
GG\¥
Appendix a Batteries and Answers to Common Questions
Power and Batteries
Low Power Annunciator
Installing Batteries
Erasing the calculator’s memory
Determining if the Calculator Requires Service
Resetting the calculator
Calculator won’t turn on
Answers to Common Questions
See Determining If the Calculator Requires Service
Environmental Limits
Appendix B More About Calculations
IRR/YR Calculations
Equations
Interest Rate Conversions
Payment Mode Factor S = 0 for End mode 1 for Begin mode
Time Value of Money TVM
Amortization
Cash-Flow Calculations
For more than one coupon period to redemption
Bonds
Statistics
Depreciation
Forecasting
Tvm registers were cleared
Appendix C Messages
Memory has been erased Ch
Cashflow memory was cleared
Statistical memory and registers were cleared
Bond registers were cleared
Replacing the Batteries
Warranty, Regulatory, and Contact Information
HP Limited Hardware Warranty and Customer Care
Limited Hardware Warranty Period
Exclusions
General Terms
Modifications
Canadian Notice
Avis Canadien
European Union Regulatory Notice
Germany
Customer Care Contact Information
Perchlorate Material special handling may apply
香港特別行
Tobago Tunisia Turkey Türkiye Turks 01-800-711-2884
ไทย
Warranty, Regulatory, and Contact Information
Warranty, Regulatory, and Contact Information
Error messages Factorial
Advance payments Algebraic mode
Battery
Chain mode
Keys
In-line functions Interest
Interest rate conversions Investments
Keyboard
Operating modes Parentheses
Trigonometric functions Troubleshooting
Warranty
Modes