McDATA 4Gb SAN Switch
Page
Contents
Page
Managing switches
Managing ports
Command Line Interface
Figures
Glossary Index
Tables
Related documentation
Intended audience
Prerequisites
Bold font
Document conventions and symbols
Jdom license
Document conventions Convention Element
HP-authorized reseller
HP technical support
Helpful web sites
Workstation requirements
Using McDATA Web Server
Starting McDATA Web Server
Exiting McDATA Web Server
Setting McDATA Web Server preferences
Viewing software version and copyright information
Using online help
Menu bars
McDATA Web Server user interface
Faceplate display menu
Topology display menu
Shortcut keys
Tool bar
Data window and tabs
Fabric tree
Graphic window
Working with switches and links
Using the topology display
Working status Indicator
Switch and link status
Opening the faceplate and topology display popup menus
Selecting switches and links
Arranging switches in the display
Layout Topology to restore the saved layout
Selecting ports
Using the faceplate display
Port views and status
Working with ports
Opening the faceplate popup menu
Faceplate data windows
Radius servers
Managing fabrics
Adding a Radius server
Removing a Radius server
Editing Radius server information
Modifying authentication order Radius server information
User account security
Security consistency checklist
Securing a fabric
Connection security
Device security
Edit Security dialog
Create Security Group dialog
Create Security Set dialog
Create Security Group Member dialog
Editing the security configuration on a switch
Viewing properties of a security set, group, or member
Security Config dialog
Fabric services
Enabling in-band management
Enabling Snmp configuration
Tracking fabric firmware and software versions
Exporting version snapshots to a file
Managing the fabric database
Saving a version snapshot
Viewing and comparing version snapshots
Rediscovering a fabric
Deleting switches and links
Removing a fabric
Opening a fabric view file
Replacing a failed switch
Adding a new switch to a fabric
Fabric status
Displaying fabric information
Displaying the Event Browser
Managing fabrics
Filtering the Event Browser
Sorting the Event Browser
Saving the Event Browser to a file
Devices data window
Link data window
Working with device information and nicknames
Active Zone Set data window
Managing device port nicknames
Displaying detailed device information
Exporting device information to a file
Exporting nicknames to a file
Creating a nickname
Editing a nickname
Deleting a nickname
Aliases
Zoning a fabric
Zoning concepts
Zones
Zoning database
Zone sets
Managing the zoning database consists of the following
Managing the zoning database
Editing the zoning database
McDATA 4Gb SAN Switch for HP p-Class BladeSystem user guide
Zoning Config dialog
Configuring the zoning database
Restoring the zoning database from a file
Restoring the default zoning database
Saving the zoning database to a file
Creating a zone set
Managing zone sets
Removing all zoning definitions
Removing a zone set
Activating and deactivating a zone set
Copying a zone to a zone set
Removing a zone from a zone set or from all zone sets
Managing zones involves the following
Managing zones
Creating a zone in a zone set
Adding zone members
Removing a zone from all zone sets
Renaming a zone or a zone set
Removing a zone member
Removing a zone from a zone Set
Removing an alias from all zones
Managing aliases
Creating an alias
Adding a member to an alias
Zone merge failure
Zone merge failure recovery
Merging fabrics and zoning
Managing fabrics
Managing user accounts
Managing switches
Creating user accounts
User Account Administration dialog Add Account tab
Removing a user account
User Account Administration dialog Remove Account tab
User Account Administration dialog Change Password tab
Changing a user account password
Modifying a user account
User Account Administration dialog Modify Account tab
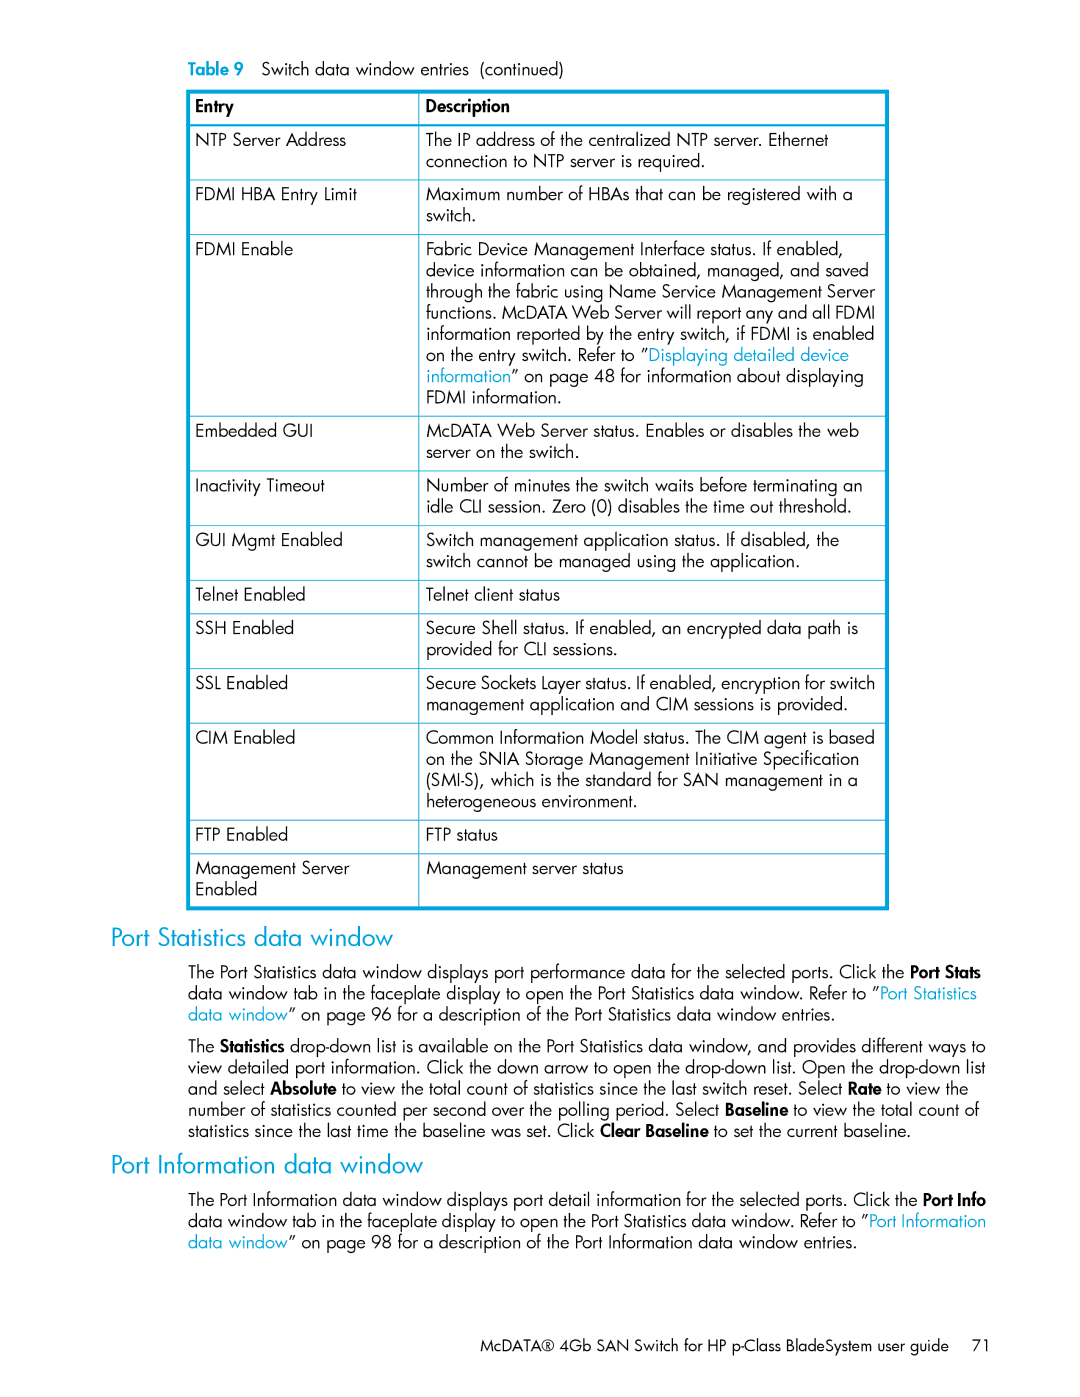
Switch data window
Displaying switch information
Error detect timeout value
Resource allocation timeout value
Time a centralized server
Zoneset is activated on a switch
Management application and CIM sessions is provided
Port Statistics data window
Port Information data window
Configured Zonesets data window
Configured Zonesets data windows
Configuring port threshold alarms
Generate falling Trigger Trigger alarm Eligibility is reset
Paging a switch
Setting the date/time and enabling NTP client
Generate rising Trigger alarm Eligibility ends
Firmware and it is disruptive to switch traffic
Resetting a switch
Symbolic name
Configuring a switch
Using the configuration wizard
Switch properties
Domain ID and domain ID lock
Switch administrative states
Fabric Device Management Interface
In-band management
Advanced switch properties
Broadcast support
Operation between two NPorts could require. The default is
System Services dialog
Timeout values
Interop mode for zoning
Security Consistency Checklist dialog
Network properties
IP configuration
NTP client
Snmp properties
Remote logging
Same. The default is private
Snmp configuration
Switch and the Snmp management server must be the same.
Default is public
Snmp trap configuration
Archiving a switch
Restoring a switch
Restoring the factory default configuration
Downloading a support file
Installing Product Feature Enablement PFE keys
Using McDATA Web Server to install firmware
Installing firmware
Using the CLI to install firmware
Hardware status LEDs
Displaying hardware status
Managing switches
Faceplate display port information
Displaying port information
Displaying port operational states
Monitoring port status
Displaying port types
Displaying transceiver media status
Displaying port speeds
Port Statistics data window
Performed
Is counted. a link reset is performed after a link failure
Number of F7, Alps LIPs, or Alpd vendor specific resets
Time it is set to try to set the port operational
May be different from the configured
Administrative state if the user has not saved it
On a switch reset
McDATA 4Gb SAN Switch for HP p-Class BladeSystem user guide
Changing port administrative states
Configuring ports
Device scan
Changing port speeds
Changing port types
Testing ports
Resetting a port
Changing port symbolic name
McDATA 4Gb SAN Switch for HP p-Class BladeSystem user guide
Managing ports
User accounts
Logging on to a 4Gb SAN Switch
Commands,
Modifying a configuration
Working with switch configurations
Backing up and restoring switch configurations
Possibilities if more than one possibility exists
Commands
Config1
Admin
Admin session commands
Show Config
See also Set Setup command,
Admin command
Opens the Admin session
Alias command
Rename aliasold aliasnew
Opens a CIM edit session
CIM command
See also CIMListener command,
Default is
CIMListener command
URL
See also CIM command,
CIMSubscription command
CIMListener command,
Config command
Save configname
See also Set Setup command,
Create command
Following is an example of the Create Certificate command
See also Date command, page 124 Set command,
See also Date command,
Date command
Displays a list of installed PFE key features
Feature command
Firmware Install command
Group command
Hash
Configures security for attachments to other switches
WWN
Group member attributes Attribute Description Secret
See also Security command,
Following is an example of the Group Edit command
Following is an example of the Group List command
Following is an example of the Group Members command
Hardreset command
Following is an example of the Help Config Edit command
Help command
History command
Hotreset command
Displays the list of image files that reside on the switch
Image command
Wait for the unpack to complete
See also Firmware Install command,
Lip command
See also User command,
Passwd command
This following is an example of an unsuccessful Ping command
Ping command
PID Ppid %CPU Time Elapsed Command
Ps command
Description Closes the Telnet session Authority None
Quit command
Operands cim Resets cim configuration to default values
Reset command
2000
InteropCredit FANEnable True
10000
Command Line Interface
McDATA 4Gb SAN Switch for HP p-Class BladeSystem user guide
Hotreset command, Set Log command,
Security command
Following is an example of the Security Limits command
Following is an example of the Security History command
See also Group command,
Securityset command
Following is an example of the Securityset List command
Following is an example of the Securityset Groups command
Allows continuous display of information without a break
Set command
Disables the display of alarms in the session output stream
Disables the flashing beacon
Places all ports offline
Prepares all ports for testing
See also Set Config command,
Places all ports online
Set Config command
Disables LCFEnable and VIEnable
Set Config port parameters Parameter Description
Using this feature
Logged-in NLPort. The default is True
Security
High, 255 is low. The default is
Default is False
Link. The default is
For errors to clear. The default is
Threshold
Should be enabled in a production environment
Default is True
Arbff
Following is an example of the Set Config Security command
Edtov
Following is an example of the Set Config Switch command
Following is an example of the Set Config Threshold command
See also Config command,
Following is an example of the Set Config Zoning command
Set Log command
Specifies all ports
Disables monitoring on all ports
Specifies no severity levels for display on the screen
Monitors none of the severity levels
Command Line Interface
Port speed is automatically detected
Set Port command
Disables the port by removing power from the port lasers
Set Setup command
Default is True
Parameter, EmbeddedGUIEnabled. The default is True
Name can be up to 64 characters excluding #, semicolon ,
Comma ,. The default is undefined
Is 1 Static
If remote logging is enabled. The default is
Becomes effective immediately. The default is False
Following is an example of the Set Setup Services command
Following is an example of the Set Setup Snmp command
Following is an example of the Set Setup System command
Displays chassis component status and temperature
Show command
Displays Link State database information
Displays name server information for all switches and ports
Displays the status of the active network interfaces
Has been detected at the receiver
Loop
Steering domainid
Switch
Following is an example of the Show Fdmi command
Displays the current time zone setting
Following is an example of the Show Domains command
Following is an example of the Show Fabric command
Following is an example of the Show NS portID command
Following is an example of the Show Fdmi WWN command
Following is an example of the Show NS local domain command
Following is an example of the Show Port command
Following is an example of the Show Interface command
Following is an example of the Show Topology command
Following is an example of the Show Switch command
See also Show Config command,
Following is an example of the Show Version command
Displays the security database Autosave parameter value
Show Config command
Displays configuration parameters for the switch
Displays alarm threshold parameters for the switch
Following is an example of the Show Config Threshold command
Following is an example of the Show Config Switch command
Following is an example of the Show Config Zoning command
Snmp events
Show Log command
Monitors all components
Displays all critical events
Displays all events related to switch management
Following is an example of the Show Log Level command
Displays all informative events Displays all warning events
See also Set Log command,
Following is an example of the Show Log Options command
Following is an example of the Show Log command
Show Perf command
Following is an example of the Show Perf Byte command
Show Setup command
Following is an example of the Show Setup Snmp command
Following is an example of the Show Setup Radius command
Following is an example of the Show Setup System command
Shutdown command
Cancels the online test in progress
Test command
Admin start
Uptime command
User command
Following is an example of the User List command
Following is an example of the User Add command
Following is an example of the User Edit command
Following is an example of the User Delete command
Whoami command
Zone command
Name server zone
See also Zoneset command,
Following is an example of the Zone Members command
Following is an example of the Zone Zonesets command
Syntax zoneset
Zoneset command
See also Zone command,
Following is an example of the Zoneset List command
Following is an example of the Zoneset Zones command
Starts a Zoning Edit session
Zoning command
Toward this maximum
E2JBOD2
Following is an example of the Zoning Limits command
Following is an example of the Zoning Limits command
Following is an example of the Zoning List command
Command Line Interface
Default Visibility setting
Alarm
On that switch
Challenge Handshake Authentication Protocol
An end-of-frame EOF delimiter
Connection between two switches using EPorts
Reset the switch or place the switch in maintenance mode
Enterprise Fabric Connectivity Manager
Level, and expiration date
Power On Self Test
Small Form-Factor Pluggable
Simple Network Management Protocol
220
Index
222
Type 129, 130 Group command
Speed 95, 101, 169 status 23 symbolic name 102 test
McDATA 4Gb SAN Switch for HP p-Class BladeSystem user guide
226