Example
$ bjobs -l 24
Job <24>, User <msmith>,Project <default>,Status <RUN>,
Queue <normal>, Interactive
date and time stamp: Submitted from host <n16>, CWD <$HOME>,
4 Processors Requested, Requested Resources <type=any>;
date and time stamp: Started on 4 Hosts/Processors <4*lsfhost.localdomain>;
date and time stamp:
SCHEDULING PARAMETERS: |
|
|
|
|
|
|
|
|
| ||
| r15s | r1m | r15m | ut | pg | io | ls | it | tmp | swp | mem |
loadSched | - | - | - | - | - | - | - | - | - | - | - |
loadStop | - | - | - | - | - | - | - |
| - | - | - |
EXTERNAL MESSAGES: |
|
|
|
| |
MSG_ID | FROM | POST_TIME | MESSAGE | ATTACHMENT | |
0 | - | - | - | - |
|
1 | lsfadmin | date and time stamp | SLURM[nodes=4] | N | |
Viewing the Historical Information for a Job
The LSF bhist command is a good tool for tracking the lifetime of a job within
Refer to the LSF bhist manpage for more information about this command, its options, and its output.
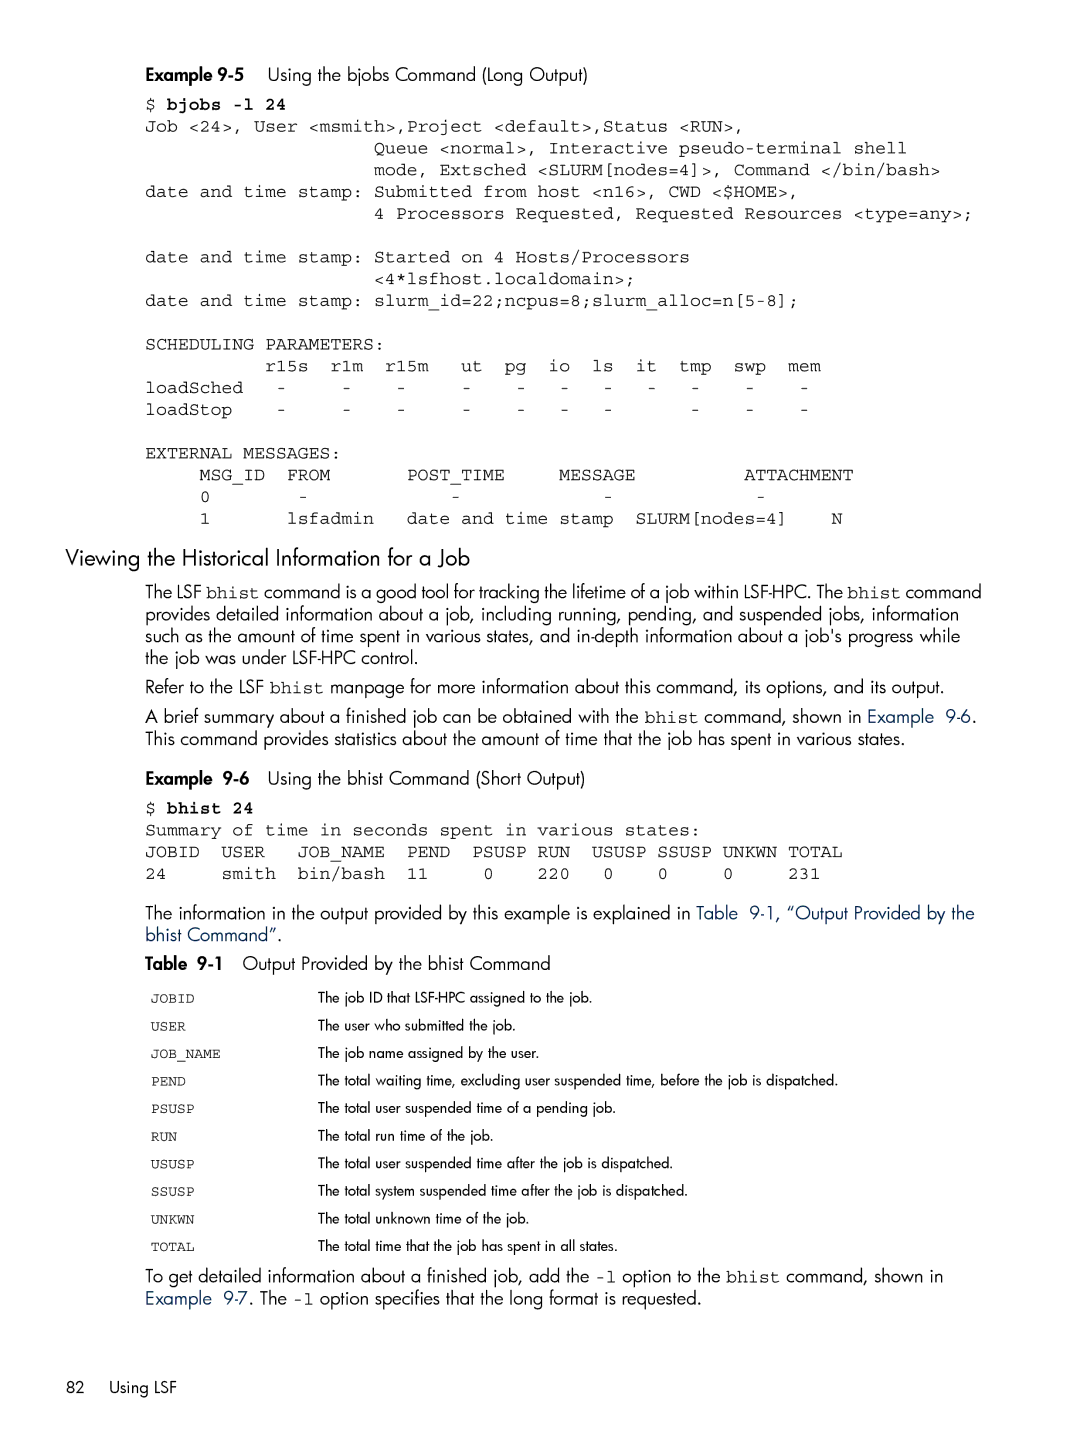
A brief summary about a finished job can be obtained with the bhist command, shown in Example
Example |
|
|
|
|
| |||||
$ bhist 24 |
|
|
|
|
|
|
|
|
| |
Summary of time in seconds spent in | various | states: |
|
| ||||||
JOBID | USER | JOB_NAME | PEND | PSUSP | RUN | USUSP | SSUSP | UNKWN | TOTAL | |
24 | smith | bin/bash | 11 | 0 | 220 | 0 |
| 0 | 0 | 231 |
The information in the output provided by this example is explained in Table
Table
JOBID | The job ID that |
USER | The user who submitted the job. |
JOB_NAME | The job name assigned by the user. |
PEND | The total waiting time, excluding user suspended time, before the job is dispatched. |
PSUSP | The total user suspended time of a pending job. |
RUN | The total run time of the job. |
USUSP | The total user suspended time after the job is dispatched. |
SSUSP | The total system suspended time after the job is dispatched. |
UNKWN | The total unknown time of the job. |
TOTAL | The total time that the job has spent in all states. |
To get detailed information about a finished job, add the
82 Using LSF
