1 RECEPTION
Following is a graph that provides the comparison between the performances of roofing filters.
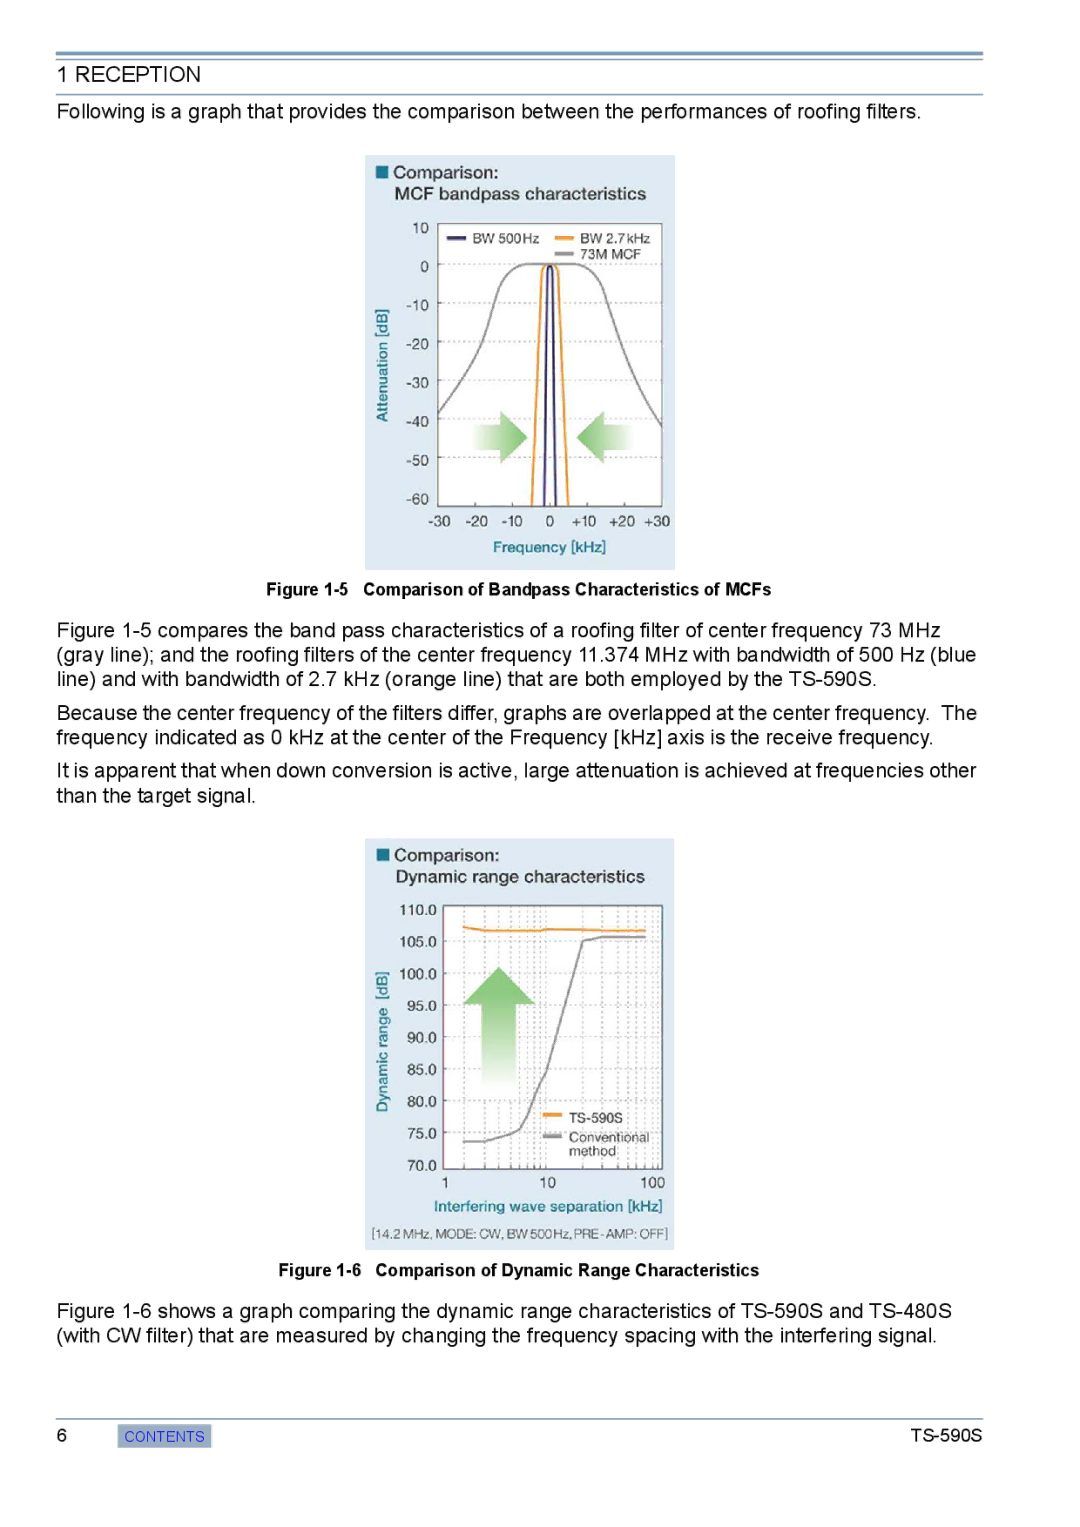
Figure 1-5 Comparison of Bandpass Characteristics of MCFs
Figure 1-5 compares the band pass characteristics of a roofing filter of center frequency 73 MHz (gray line); and the roofing filters of the center frequency 11.374 MHz with bandwidth of 500 Hz (blue line) and with bandwidth of 2.7 kHz (orange line) that are both employed by the TS-590S.
Because the center frequency of the filters differ, graphs are overlapped at the center frequency. The frequency indicated as 0 kHz at the center of the Frequency [kHz] axis is the receive frequency.
It is apparent that when down conversion is active, large attenuation is achieved at frequencies other than the target signal.
Figure 1-6 Comparison of Dynamic Range Characteristics
Figure 1-6 shows a graph comparing the dynamic range characteristics of TS-590S and TS-480S (with CW filter) that are measured by changing the frequency spacing with the interfering signal.
6
CONTENTS