Annual report pursuant to or 15d
Washington, D.C
Securities Exchange Act
For the transition period from
Explanatory Note
Table of Contents
Item 9A
Item 1. Business Overview
Part
Business environment
Developments in 2003
Page
2003
Strategic plan
Other business developments
Networking solutions
Networking solutions
Networking
Network components
Products
Wireless Networks
Core networking
Network access
Product development
Customers
Markets
Competition
Circuit and packet voice solutions
Enterprise Networks
Data networking and security solutions
Wireline Networks
Circuit and packet voice solutions
Markets
Optical Networks
Product development
Markets
Backlog
Sales and distribution
Sources and availability of materials
Product standards, certification and regulations
Strategic alliances, acquisitions and minority investments
Seasonality
Intellectual property
Research and development
Employee relations
Financial information by geographic area
Environmental matters
Risk factors
Working capital
Type of Site
Item 2. Properties
Number of Sites Owned Leased
Geographic Locations
Item 3. Legal Proceedings
Page
Page
Environmental matters
High Low
Item 4. Submission of Matters to a Vote of Security Holders
Canadian tax matters
Dividends
Sales of unregistered securities
Dividends
Item 6. Selected Financial Data Unaudited
2003 2002 2001 2000
Total
Revenues and cost of revenues adjustments
Other adjustments
Business overview
Accounting changes and recent accounting pronouncements
Our segments
Business overview
Our business
Our business environment
How we measure performance
Our strategic plan and outlook
Comprehensive Review and First Restatement
Consolidated results summary
Years ended December 31, 2002
Independent Review
Second Restatement
Revenues and cost of revenues
Intercompany balances
Foreign exchange
Special charges
Other
Dis operations
First, second and third quarters
Reclassifications
Page
Revenues and cost of revenues
Intercompany balances
EDC Support Facility
Revenue Independent Review
Personnel actions
Debt securities
Credit facilities and security agreements
Credit ratings
Shelf registration statement
Regulatory actions and pending litigation
Stock-based compensation plans
Shareholder rights plan
Evolution of our supply chain strategy
Other business developments
Customer financing commitments
Ownership adjustment in our French and German operations
Sale of Entrust shares
Real estate
Customer financing arrangements
Results of operations continuing operations
Segment revenues
Geographic revenues
2004
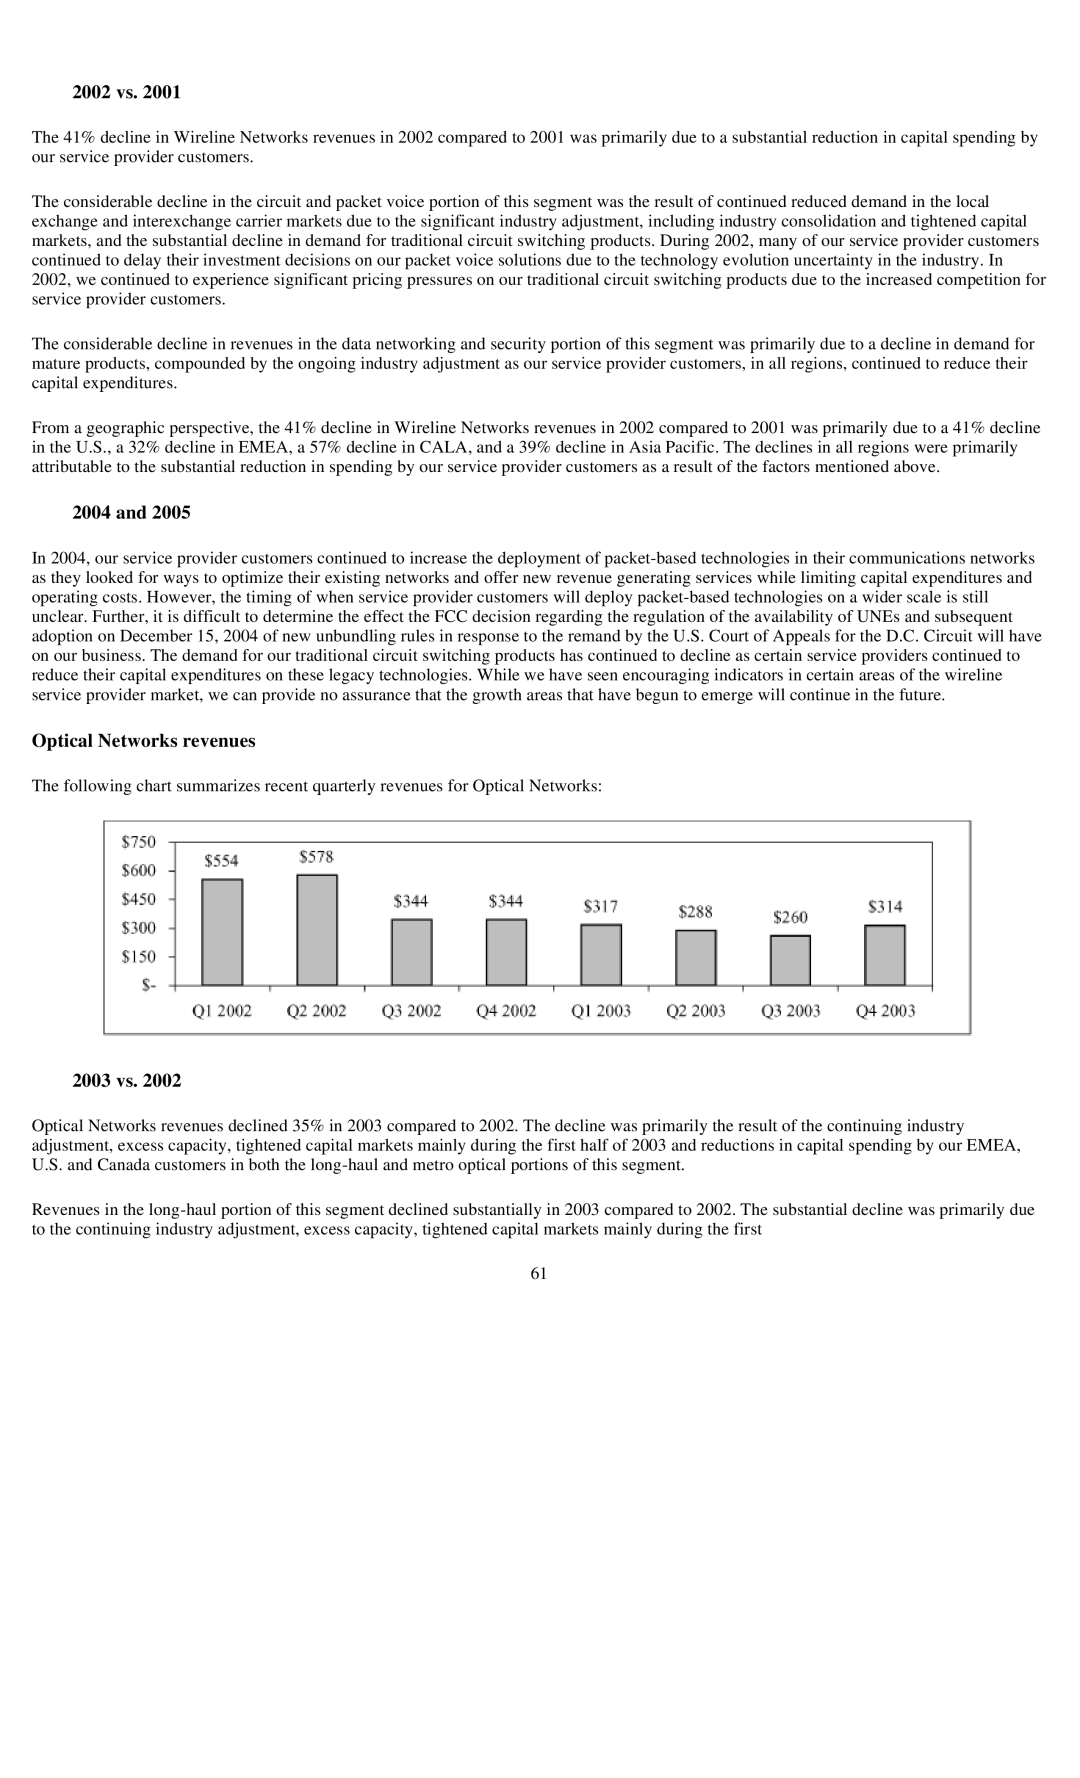
2003 vs
2002 vs
Wireless Networks revenues
2002 vs
Enterprise Networks revenues
2002 vs
Wireline Networks revenues
Optical Networks revenues
2002 vs
Gross profit and gross margin
Wireless Networks
Segment gross profit and gross margin
For the years ended December 2003 vs 2002 vs 2001
Optical Networks
Wireline Networks
Enterprise Networks
Segment selling, general and administrative expense
Selling, general and administrative expense
Operating expenses
For the years ended December 2003 vs 2002 vs 2001 $ Change
Research and development expense
Segment research and development expense
Segment Management EBT
Segment contribution margin
Amortization of intangibles
Deferred stock option compensation
Special charges
Page
Other income expense net
Gain loss on sale of businesses and assets
Interest expense
Results of operations dis operations
Income tax benefit expense
Net earnings loss from continuing operations
2003 2002
Liquidity and capital resources
Cash flows
Page
Uses of liquidity
Purchase obligations
Contractual cash obligations
Outsourcing contracts
Obligations under special charges
Customer financing
JDS purchase arrangement
Pension, post-retirement and post-employment obligations
Other long-term liabilities reflected on the balance sheets
Dis operations
Joint ventures/minority interests
Sources of liquidity
Credit facilities
Shelf registration statement and base shelf prospectus
Bid, performance related and other bonds
Off-balance sheet arrangements
Credit ratings
Other indemnifications or guarantees
Revenue recognition
Application of critical accounting estimates
Provisions for doubtful accounts
Provisions for inventory
Tax asset valuation
Income taxes
Goodwill valuation
Tax contingencies
Pension and post-retirement benefits
Change in Assumption
Special charges
Accounting changes
Accounting changes and recent accounting pronouncements
Other contingencies
Recent accounting pronouncements
Market risk
Equity price risk
Risks relating to our restatements and related matters
Legal proceedings
Risk factors/forward looking statements
Page
Operations, financial condition and liquidity
Page
Page
Page
Page
Risks relating to our business
Page
Page
Page
Page
104
Page
Page
Page
Page
Page
Page
Page
Index to Consolidated Financial Statements
Report of Independent Registered Chartered Accountants
Nortel Networks Corporation
Assets
Consolidated Balance Sheets as of December
Total comprehensive income loss for the year
Cash flows from used in operating activities
Significant accounting policies
Nortel Networks Corporation
Basis of presentation
Principles of consolidation
Revenue recognition
Translation of foreign currencies
Research and development
Earnings loss per common share
Income taxes
Cash and cash equivalents
Restricted cash and cash equivalents
Plant and equipment
Receivables sales
Investments
Goodwill
Long-lived assets held and used
Intangible assets
Warranty costs
Pension, post-retirement and post-employment benefits
Derivative financial instruments
Stock-based compensation
2003 2002 2001
2003 2002 2001 Black-Scholes weighted-average assumptions
Weighted-average stock option fair value per option granted
Recent accounting pronouncements
Comparative figures
Second Restatement
Restatement
First Restatement
Page
Page
121 Total restatement adjustments 289 183 314 272
Page
Revenues and cost of revenues
Other adjustments
Revenue recognition adjustments
Application of SAB 101 or SOP
Revenues Cost of revenues 2002 2001
Presentation errors
Other revenue recognition adjustments
Reseller transactions
Foreign exchange
Functional currency designation
Other errors
Intercompany transaction designation
Goodwill impairment 980 Nplc business acquisition
Other
Goodwill impairment other acquisitions
Other special charges
2002 2001 Other adjustments
Selling, general and administrative expense
Cost of revenues
Research and development expense
Interest expense
Other income expense net
Income taxes and minority interests
Reclassifications
Decrease to net loss on disposal of operations net of tax
Dis operations
Balance sheet
Other adjustments
Accounting changes
Guarantees
Consolidated Balance Sheet as of December 31
Consolidation of variable interest entities
Asset retirement obligations
Page
Pensions and other post-retirement benefits
Determining whether an arrangement contains a lease
Stock-based compensation
Accounting for goodwill and other intangible assets
23,270
Consolidated statements of operations
Derivative financial instruments
Consolidated financial statement details
Accounts receivable net
Consolidated balance sheets
Inventories net
Other current assets
Goodwill
Wireless Enterprise Wireline
Intangible assets net
Other accrued liabilities
Other liabilities
Interest and taxes paid recovered
Minority interests in subsidiary companies
Change in operating assets and liabilities
Segment information General description
Receivables sales
Product revenues
Segments
2003 2002 2001 Revenues
Contribution margin
Long-lived assets
Geographic information
Year ended December 31
Special charges
During December 2003 Lease costs a
Accrued Costs Payments Adjustments Balance as Incurred Made
January
Year ended December 31
Income taxes
2003 2002 2001
Credits b Total
Employee benefit plans
Net Operating Capital Tax Losses
Page
Change in plan assets
2003 2002 Change in benefit obligation
Defined benefit plans 20032002
2003 2002 2001 Pension expense
Allocation of net pension expense
2003 2002 Target Actual
2003 2002 2001 Post-retirement benefit cost
Page
Net tangible Deferred Closing date Purchase
Other acquisitions
Acquisition Price Goodwill Technology
Compensation
Divestitures
Service commerce operations
Sale of Arris Group, Inc. investment
High speed module operations
Closures
Sale of Clarify
Long-term debt, credit and support facilities
Long-term debt
Credit facilities
Financial instruments and hedging activities
Support facility
Risk management
Foreign currency risk
Fair value
Equity price risk
2003 2002 Interest rate swap contracts
Cross currency coupon swap contracts
Other derivatives
Credit risk
Receivables sales
Fair
Intellectual property indemnification obligations
Guarantees
Business sale and business combination agreements
Third party debt agreements
Lease agreements
Product warranties
Other indemnification agreements
Commitments
Bid, performance related and other bonds
Venture capital financing
Customer financing
Operating leases and other commitments
Purchase commitments
Operating Outsourcing
Leases Contracts Charges Income
Capital stock Common shares
Restricted cash and cash equivalents
Prepaid forward purchase contracts
Dividends
Preferred shares
Shareholder rights plan
Earnings loss per common share
Stock-based compensation plans Stock options
Accumulated other comprehensive loss
Maximum
Options
Restricted stock unit plan
Employee stock purchase plans
Directors’ deferred share compensation plans
Dis operations
2003 2002 2001 Cash flows from used in dis operations
Activity
Activity
Contingencies
Related party transactions
Page
Page
Environmental matters
Subsequent events
EDC Support Facility
Credit facilities and security agreements
Debt securities
Directory and operator services business
Stock-based compensation plans
Stock exchanges
Evolution of Nortel Networks supply chain strategy
Supplemental consolidating financial information
Nortel Non
Nortel Non
612 450 15,364 380
Supplemental Consolidating Balance Sheets as of December 31
182 240 413 388 262 16,961
Nortel Non Networks
818 592 487 525 768
572 111 648 206
Quarterly Financial Data Unaudited
Report of Independent Registered Chartered Accountants
Additions
Schedule Consolidated
Charged
Beginning To costs End
Item 9A. Controls and Procedures
114
Scope of the Independent Review
Summary of Findings of the Independent Review
Page
Page
Page
Governing Principles for Remedial Measures
Page
Page
Page
Page
Additional Background
Page
Second Restatement Independent Review
Second Restatement Process
Page
Fixed or determinable fees-An increase of $133 million
Page
Principal Adjustments
Page
Page
Revenue Independent Review
Remedial Measures
Page
Name Age Position with the Company
Page
Page
Page
Name and age Office and position currently held Appointment
Year
Subsequent appointment
Audit committee financial expert
Beneficial ownership reporting compliance
Audit committee
Code of ethics and other corporate governance matters
Summary compensation table
Item 11. Executive Compensation
Year
Long Term Compensation Name Principal Position
Annual Compensation
Salary Bonus
147
148
149
150
Option grants in 2004
Annual cash incentive awards
Value of Unexercised
Common
In-the-Money
Realized $ Exercisable
152
Exercisable Unexercisable
Dunn Debon Spradley Bolouri DeRoma
Maturation or Payout Threshold# Target# Maximum# #12
Long-term incentive plans awards in last two fiscal years
Retirement plans
Page
Total Earnings
Certain employment arrangements
Page
Compensation of directors
Security ownership of directors and management
Compensation committee interlocks and insider participation
Title of Class of Security
Name of Beneficial Owner
163
Plan category
Equity compensation plan information
Indebtedness of management
Item 13. Certain Relationships and Related Transactions
Table of Indebtedness of Directors and Executive Officers
Item 14. Principal Accountant Fees and Services
Audit Fees
January 1
All Other Fees
Audit-Related Fees
Tax Fees
Reports on Form 8-K
Page
Page
Page
Number Description
Exhibit Index
Exhibit
Number Description
Number Description
Number Description
Number Description
Number Description
Subsidiary of Nortel Networks Limited
Report of Independent Registered Public Accounting Firm
182
183
184
Nortel Networks S.A
Nortel Networks S.A
Use of estimates
Research and development
Cash and cash equivalents
Plant and equipment
Financial instruments
State sponsored pension plans
192
Restatement
Interest
Second Pooling Previously
Reported
Restated
Interest Pooled Reported
Accruals
Net increase decrease to net loss
Accruals and provisions
2002 2001 Increase decrease of cost of revenues
Net increase decrease of cost of revenues
Related party transactions
Other expenses
2002 2001 Increase decrease of research and development
Net increase decrease of research and development
Related party revenues and cost of revenues
Residual profit sharing
Related party out of balances
Plant and equipment
Interest on long- term debt
Costs of revenues, research and development expense
Consolidated Balance Sheets as of December 31
Guarantees
Consolidation of variable interest entities
Asset retirement obligations
Accounting for goodwill and other intangible assets
Determining whether an arrangement contains a lease
Stock-based compensation
Derivative financial instruments
204
Wireline Optical
Wireless
Investment at cost net
Networks
Long-term debt
Segment information General description
Major customers
Long-lived assets
Geographic information
2003 2002 2001 External revenues
Contract
Expected sublease revenue on leases
Income taxes
Northern Telecom France
Acquisitions and divestitures Acquisitions
Nortel Networks France
Matra Nortel Communication Distribution
Other profit sharing agreements
Financing transactions
Royalties
Sale of investment
Share pledge
Financial instruments
Joint ventures/minority interests/disposed business
Leases Contracts
Shareholders’ equity
Plan a
Outstanding Weighted Options
Nortel Networks Company Savings Plan
Security agreements
Page
Signatures
Directors