AVision 90t/100t Color Gamut Adjustment
Only
Note procedure!
For most applications, the Display Color controls in the Calibration menu are adequate for producing accurate and realistic colors from a variety of sources.
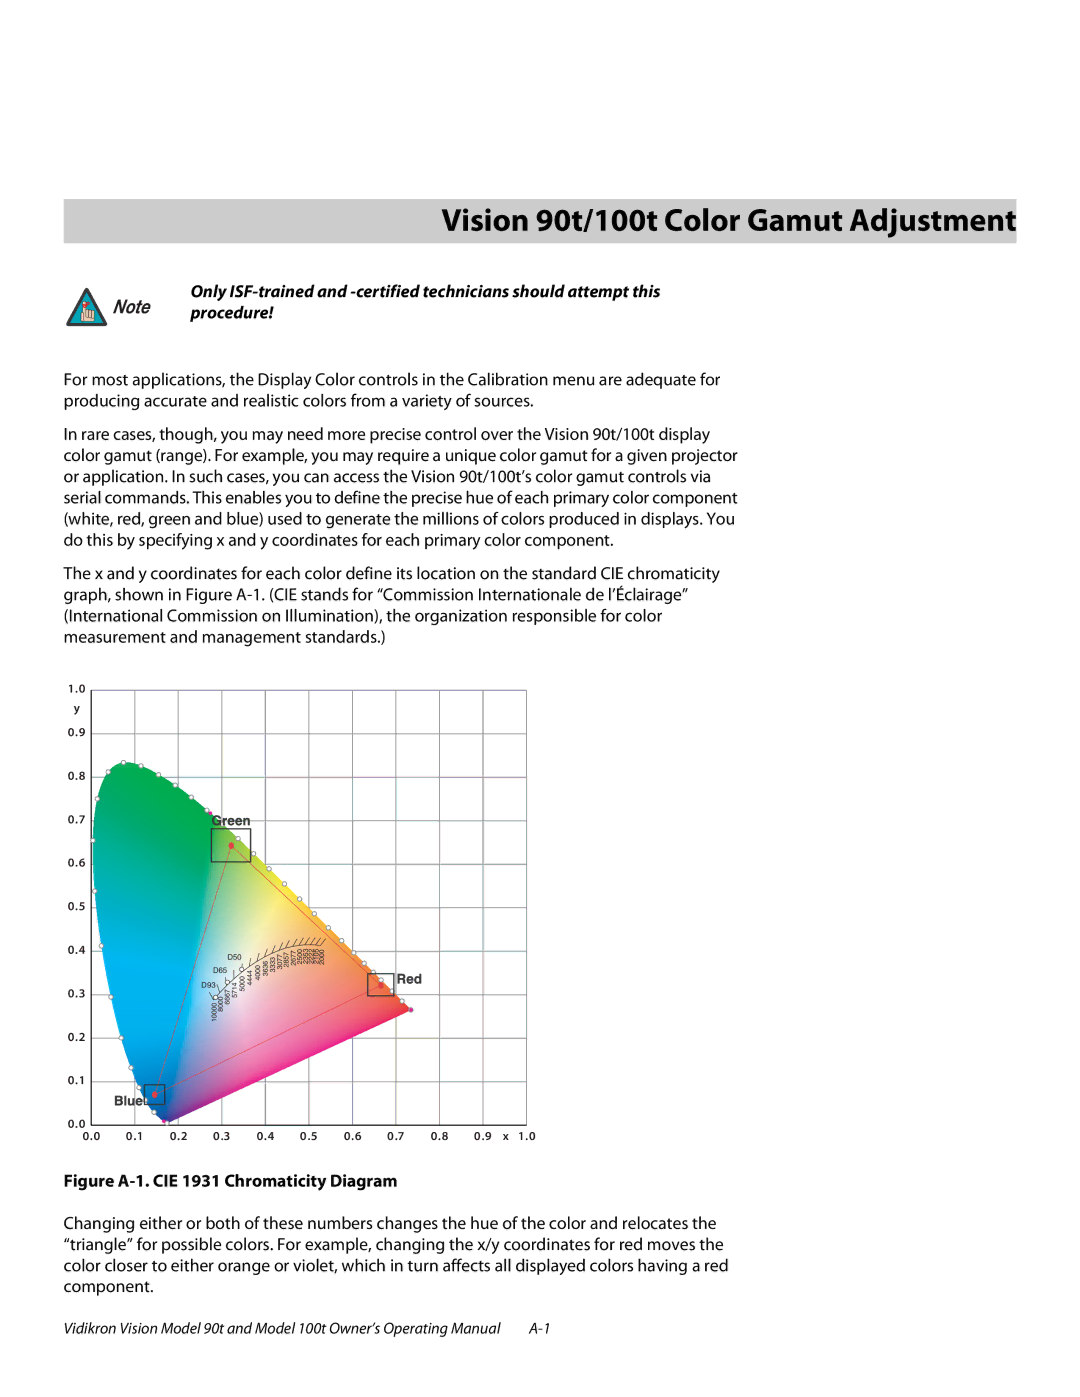
In rare cases, though, you may need more precise control over the Vision 90t/100t display color gamut (range). For example, you may require a unique color gamut for a given projector or application. In such cases, you can access the Vision 90t/100t’s color gamut controls via serial commands. This enables you to define the precise hue of each primary color component (white, red, green and blue) used to generate the millions of colors produced in displays. You do this by specifying x and y coordinates for each primary color component.
The x and y coordinates for each color define its location on the standard CIE chromaticity graph, shown in Figure
1.0 |
|
|
|
|
|
|
|
|
|
|
|
|
|
|
|
|
|
|
|
|
y |
|
|
|
|
|
|
|
|
|
|
|
|
|
|
|
|
|
|
|
|
0.9 |
|
|
|
|
|
|
|
|
|
|
|
|
|
|
|
|
|
|
|
|
0.8 |
|
|
|
|
|
|
|
|
|
|
|
|
|
|
|
|
|
|
|
|
0.7 |
|
|
|
|
|
|
|
|
|
|
|
|
|
|
|
|
|
|
|
|
0.6 |
|
|
|
|
|
|
|
|
|
|
|
|
|
|
|
|
|
|
|
|
0.5 |
|
|
|
|
|
|
|
|
|
|
|
|
|
|
|
|
|
|
|
|
0.4 |
|
| 10000 | 8000 | 6676 | 5147 | 5000 | 4444 | 4000 | 3636 | 3333 | 0773 | 8572 | 7762 2500 2353 2222 2105 2000 |
|
|
|
|
|
|
|
|
|
|
| D50 |
|
|
|
|
|
|
|
|
|
|
|
|
| ||
|
|
| D65 |
|
|
|
|
|
|
|
|
|
|
|
|
|
|
| ||
0.3 |
|
| D93 |
|
|
|
|
|
|
|
|
|
|
|
|
|
|
|
|
|
|
|
|
|
|
|
|
|
|
|
|
|
|
|
|
|
|
|
|
| |
0.2 |
|
|
|
|
|
|
|
|
|
|
|
|
|
|
|
|
|
|
|
|
0.1 |
|
|
|
|
|
|
|
|
|
|
|
|
|
|
|
|
|
|
|
|
0.0 |
|
|
|
|
|
|
|
|
|
|
|
|
|
|
|
|
|
| x |
|
0.0 | 0.1 | 0.2 | 0.3 |
|
|
| 0.4 |
|
| 0.5 | 0.6 | 0.7 | 0.8 | 0.9 | 1.0 | |||||
Figure A-1. CIE 1931 Chromaticity Diagram
Changing either or both of these numbers changes the hue of the color and relocates the “triangle” for possible colors. For example, changing the x/y coordinates for red moves the color closer to either orange or violet, which in turn affects all displayed colors having a red component.
Vidikron Vision Model 90t and Model 100t Owner’s Operating Manual |