Model ProxyBlocker
Guide
8E6 TECHNOLOGIES, Proxyblocker User Guide
8E6 Proxyblocker User Guide
8E6 TECHNOLOGIES, Proxyblocker User Guide
Contents
Introduction System screen
Getting Started
105
Group screen 199
Library screen 248
Reporting screen 290
312
Introduction 311
Technical Support 390
367
Product Warranties 393
Appendix B 400
Appendix a 396
Appendix C 408
Appendix D 423
Appendix F 437
Appendix E 434
Appendix H 448
About this User Guide
8e6 ProxyBlocker
Introductory Section about this User Guide
Conventions
How to Use this User Guide
Terminology
Introductory Section HOW to USE this User Guide
Introductory Section HOW to USE this User Guide
Introductory Section HOW to USE this User Guide
Introductory Section HOW to USE this User Guide
Overview
Workstation Requirements
Environment Requirements
Network Requirements
Filtering Operations
Invisible Mode
Pass-by filtering diagram
Global Group
Group Types
IP Groups
IP diagram with a sample master IP group and its members
Global Group
Filtering Profile Types
IP group master group
IP group member
Master IP Group Filtering Profile
Static Filtering Profiles
IP Sub-Group Filtering Profile
Individual IP Member Filtering Profile
Global Filtering Profile
Active Filtering Profiles
Override Account Profile
Time Profile
Filtering Profile Components
8e6 Supplied Categories
Library Categories
Custom Categories
Rules
Service Ports
Minimum Filtering Level
Filter Settings
Filtering Levels Applied
Filtering Rules
Introductory Section Filtering Operations
Sample filtering hierarchy diagram
Logging and Blocking
Web Access Logging
How IM and P2P Blocking Works
Instant Messaging, Peer-to-Peer Blocking
IM Blocking
P2P Blocking
Setting up IM and P2P
Block IM, P2P for All Users
Using IM and P2P
Block IM for All Users
Block P2P for All Users
Block Specified Entities from Using IM, P2P
Block IM for a Specific Entity
Block P2P for a Specific Entity
Using the Administrator Console
Initial Setup
Getting Started
Log On
ProxyBlocker Introductory Window
Welcome screen
Last Library Update message
Welcome screen, Last Library Update text
Navigation Tips
Access Main Sections
Help screen
Access Help Topics
Help Features
Hover Display
Tooltips
Help pop-up box
Screen and Window Navigation
Selected topic and its corresponding window
Topic Links
10 Sub-topics menu
Select Sub-topics
11 Tree menu
Navigate a Tree List
12 Tree list topics and sub-topics
Tree List Topics and Sub-topics
13 Window with tabs
Navigate a Window with Tabs
Navigation Path
Console Tips and Shortcuts
Select Multiple Items
Refresh the Console
Copy and Paste Text
15 IP Calculator pop-up window
Calculate IP Ranges without Overlaps
16 Quit dialog box
Log Off
Introduction
Global Administrator Section
System screen
System screen
Global Administrator Section System Screen
System screen, Control menu
Control
Filter window
Filter window
Enable Local Filtering Options
Disable Local Filtering Options
Local Filtering
Files/1systemproxyblock .html for a list of proxy pattern
Disable Http Packet Splitting Detection
Enable Http Packet Splitting Detection
Http Filtering
Https Filtering
Enable Pattern Blocking
Service Control
Disable Pattern Blocking
Block Page Authentication window
Block Page Authentication window
Enter, Edit Block Page Options
Global Administrator Section System Screen
Sample Block
Block
Global Administrator Section System Screen
Help link
Options
Option
Re-authentication option
Profile Control pop-up window
Shut Down the Server
ShutDown window
10 Reboot window
Reboot window
11 Reboot ProxyBlocker dialog box
Reboot the Server
14 ProxyBlocker ready alert box
16 System screen, Network menu
Network
17 LAN Settings window
LAN Settings window
Specify LAN Settings
18 NTP Servers window
NTP Servers window
Add an NTP Server
Specify Network Time Protocol Servers
Remove an NTP Server
19 Regional Setting window
Regional Setting window
Specify the Time Zone, Language Set
20 Block Page Route Table window
Block Page Route Table window
Remove a Router
Add a Router
Administrator window
Administrator
Add an Administrator Account
View Administrator Accounts
Delete an Administrator Account
Edit an Administrator Account
22 System screen, Secure Logon window
Secure Logon
23 Logon Settings window
Logon Settings window
24 New password entry
Enable, Disable Password Expiration
Enable, Disable Account Lockout
Global Administrator Section System Screen
25 Logon Management window
Logon Management
View Account Status
View User Account Status, Unlock Username
Unlock a Username
View Locked IP Address, Unlock IP Address
View Locked IPs
Unlock an IP Address
26 Assign Access View
View Admin, Sub Admin Interface Access
27 System screen, Diagnostics menu
Diagnostics
28 System Command window
System Command window
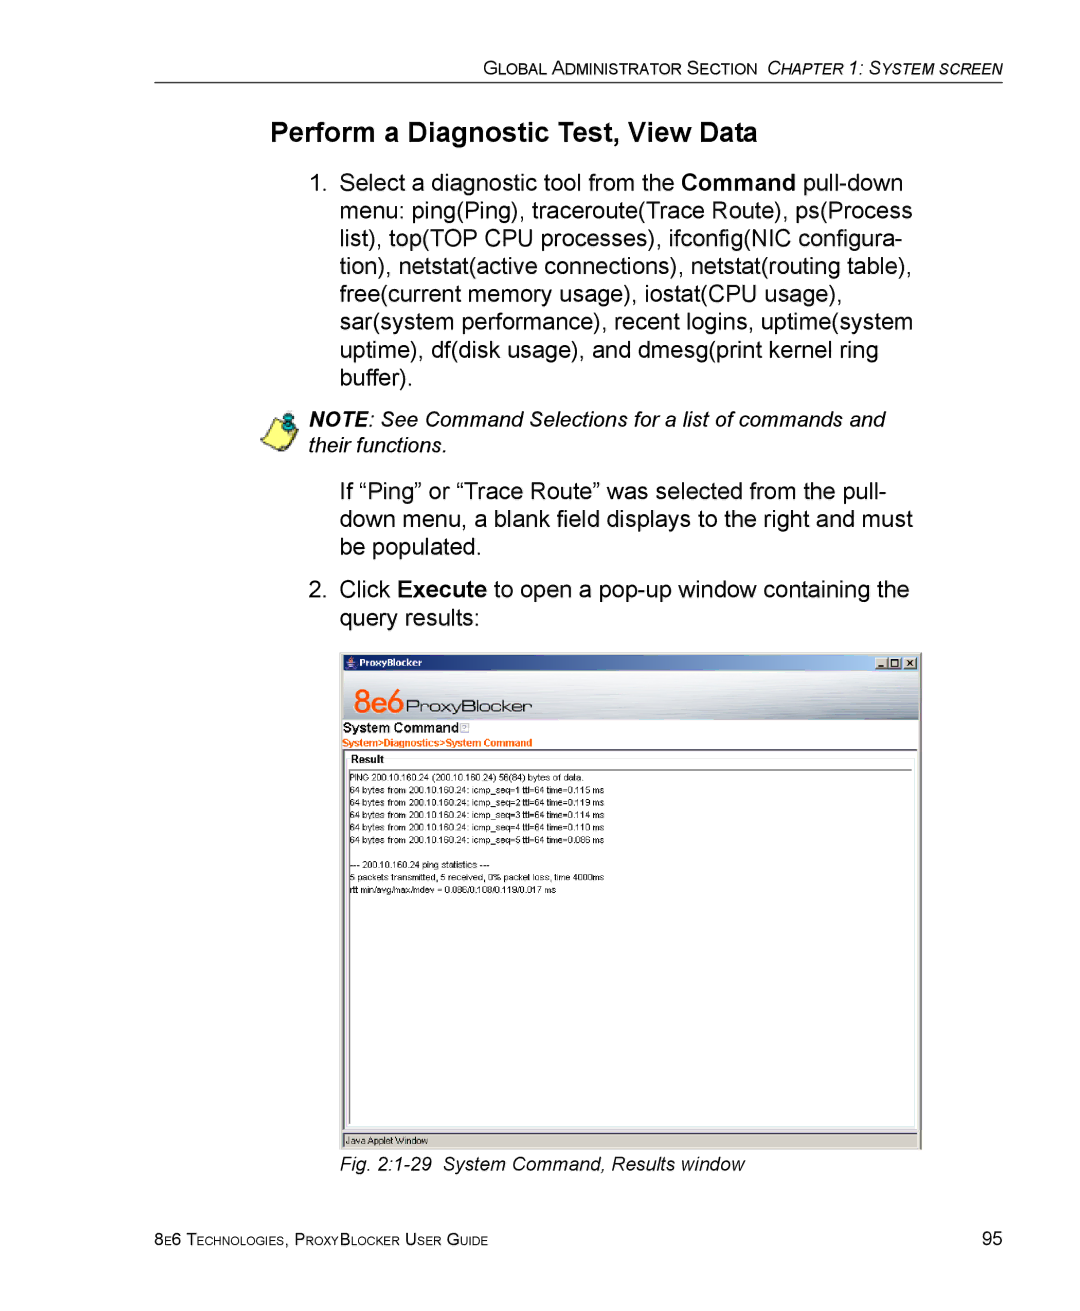
29 System Command, Results window
Perform a Diagnostic Test, View Data
Ping
Command Selections
Trace Route
Process list
TOP CPU processes
NIC configuration
Active connections
Routing table
Current memory usage
Recent logins
CPU usage
System performance
Dfdisk usage
System uptime
Dmesgprint kernel ring buffer
30 View Log File window
View Log File window
View Log Results
31 View Log File, Results window
32 Troubleshooting Mode window
Troubleshooting Mode window
Use the Troubleshooting Mode
33 Active Profile Lookup window
Active Profile Lookup window
34 Active Profile Lookup results
Verify Whether a Profile is Active
Block URLs in this category will be blocked
108
Admin Audit Trail
Admin Audit Trail window
FTP the Log on Demand
Specify FTP Criteria
View
View the Log of Administrator Changes
37 System screen, Alert menu
Alert
38 Alert window
Alert Settings window
114
Modify Alert Settings
Enable the Alert Feature
Disable the Alert Feature
Enter, Edit Smtp Server Settings
Smtp Server Settings window
40 Smtp Test Settings box
Verify Smtp Settings
41 System screen, Patch menu
Patch
42 Local Patch window
Local Patch window
43 Software update Readme
Read Information about a Software Update
44 Software update installation dialog box
Select and Apply a Software Update
46 Software update verification message box
Undo an Applied Software Update
View Log Contents
Patch Update Log window
Download Log, View, Print Contents
51 Download Complete box
View the Contents of the Log
54 WinZip window
Save, Print the Log File Contents
Mode
57 System screen, Mode menu
Specify the Listening Device
Operation Mode window
Specify the Block Page Delivery
Specify the Block Page Device
Apply Settings
59 Proxy Environment Settings window
Proxy Environment Settings window
Use Proxy Port
Use a Local Proxy Server
60 System screen, Authentication menu
Authentication
NIC Mode window
NIC Mode
62 NIC Negotiation window
View the NIC Negotiation
Modify the NIC Mode Setting
Backup/Restore window
Backup/Restore
Backup Procedures
64 ProxyBlocker Backup dialog box
Perform a Backup
65 File Download box
Download a File
67 Download complete box
Upload a File to the Server
Perform a Restoration
69 Choose file window
Restore Configurations to the Server
View Backup and Restoration Details
Remove a Backup File
Reset window
Reset
Reset All Server Settings
Snmp window
Snmp
Specify Monitoring Settings
Enable Snmp
Set up Community Token for Public Access
Create, Build the Access Control List
Hardware Failure Detection window
Hardware Failure Detection
View the Status of the Hard Drives
Strikes Blocking window
Strikes Blocking
Set up Blocking Criteria
Configuration
Lock
Reset All Workstations
Overblocking or Underblocking
Sample Settings
157
Email Alert
Set up Email Alert Criteria
77 The Daily Schedule pop-up window
Set up Email Alert Recipients
Logon Accounts
Set up Users Authorized to Unlock Workstations
Remove Email Alert Recipients
Delete a Logon Account
Deactivate an Authorized Logon Account
Categories
Set up Categories to Receive Strikes or No Strikes
Go to X Strikes Unlock Workstation GUI
Re-login window
Unlock a Workstation
Strikes Unlock Workstation
Remove an Email Address from the Alert List
Set up an Email Address to Receive Alerts
Close the Pop-up Window
Click Subscribe
Warn Option Setting window
Warn Option Setting
Specify the Interval for Re-displaying the Warn
83 System screen, Customization menu
Customization
84 Common Customization window
Common Customization window
Enable, Disable Features
171
85 Lock Page Customization window
Lock Page Customization window
Edit Entries, Setting
86 Sample Customized Lock
Preview Sample Lock
87 Block Page Customization window
Block Page Customization window
Add, Edit Entries
88 Sample Customized Block
Preview Sample Block
178
89 Warn Page Customization window
Warn Page Customization window
180
90 Sample Customized Warning
Preview Sample Warning
182
183
91 Profile Control window
Profile Control window
Edit Entries
92 Quota Block Page Customization window
Quota Block Page Customization window
187
93 Sample Customized Quota Block
Preview Sample Quota Block
94 Quota Notice Page Customization window
Quota Notice Page Customization window
190
95 Sample Customized Quota Notice
Preview Sample Quota Notice
192
Quota Setting window
Quota Setting
Reset Quotas
Configure Quota Hit Settings
Reset Quotas Now
Delete a Quota Reset Time from the Schedule
Set up a Schedule to Automatically Reset Quotas
At the New Reset Time Hhmm field
97 Sample Quota Notice
Quota Notice
98 Sample Quota Block
Quota Block
198
Group screen
Group screen
200
Group screen, Global Group menu
Global Group
Range to Detect window
Range to Detect Settings window, main window
Add a Segment to the Network
Range to Detect Settings, second window
Step
Range to Detect Setup Wizard
205
Optional
Range to Detect Setup Wizard window, Step
207
208
209
10 Range to Detect Setup Wizard window, Step
11 Range to Detect Advanced Settings window
Range to Detect Advanced Settings
Remove a Segment from the Network
Modify a Segment of the Network
12 Rules window
Rules window
Add a Rule
View Criteria for a Rule
215
Copy a Rule
Modify a Rule
Click Save Rule
Click Delete Rule
Remove a Rule
13 Global Group Profile window, Category tab
Global Group Profile window
Create, Edit a List of Selected Categories
Category Profile
220
221
Port
Create, Edit a List of Service Ports
Create, Edit the Redirect URL
Default Redirect URL
Create, Edit the Filter Options
Filter Options
Strikes Blocking
Search Engine Keyword Filter Control
URL Keyword Filter Control
17 Override Account window
Override Account window
Add an Override Account
18 Override Account pop-up window, Rule tab
Category Profile
231
232
19 Override Account pop-up window, Redirect tab
Redirect URL
20 Override Account pop-up window, Filter Options tab
Filter Options
235
236
Edit an Override Account
Change the Password
Modify an Override Account
Delete an Override Account
Minimum Filtering Level window
Minimum Filtering Categories
21 Minimum Filtering Level window, Min. Filtering Categories
Create, Edit Minimum Filtering Categories
22 Minimum Filtering Level window, Port tab
23 Minimum Filtering Level window, Min. Filter Bypass tab
Minimum Filtering Bypass Options
Specify Minimum Filtering Bypass Options
Refresh All Main Branches
Refresh All
24 Group screen, IP menu
Add a Master IP Group
Add Group
Refresh IP Groups
Refresh
Library screen
Library screen
249
Library screen, Updates menu
Updates
Set a Time for Updates to be Retrieved
Configuration window
Select the Log Level
Optional Specify a Proxy Server
Manual Update window
Manual Update window
Specify the Type of On Demand Update
Select Additional Languages
Additional Language Support window
256
View the Library Update Process
Library Update Log window
Download Log dialog box
Download Complete box
10 Folder containing downloaded file
12 WinZip window
15 Notepad
View the Emergency Software Update Process
Emergency Update Log window
Download the Software Update Log File
Library Lookup window
Library Lookup
Perform a URL Check
URL Lookup, Removal
Remove a URL
Submit an Email to the Administrator
Click Email Result
Reload the Library
Search Engine Keyword Lookup, Removal
Perform a Search Engine Keyword Check
Remove a Search Engine Keyword
Category Weight System window
Category Weight System
View the Current Selections
Method for Weighting Library Categories
Select the category from the No Weight Categories list box
Weighting Library Categories
Nntp Newsgroup window
Nntp Newsgroup
Add a Newsgroup to the Library
Remove a Newsgroup from the Library
20 Library screen, Category Groups menu
Category Groups
275
View Library Details
Library Details window
22 URLs window, Action tab
URLs window
23 URLs window, View tab
View a List of URLs in the Library Category
Add a URL to the Library Category
Add or Remove URLs, Reload the Library
Click Apply Action
Add a Wildcard URL to the Library Category
Reload the Library
Remove a URL from the Library Category
24 URL Keywords window
URL Keywords window
Add or Remove URL Keywords
View a List of URL Keywords
Add a URL Keyword to the Library Category
Remove a URL Keyword from the Library
Upload a List of URL Keyword Additions
Upload a List of URL Keywords to the Library
Upload a List of URL Keyword Deletions
26 Search Engine Keywords window
Search Engine Keywords window
Add or Remove Search Engine Keywords
View a List of Search Engine Keywords
Add a Search Engine Keyword to the Library
Remove a Search Engine Keyword from the Library
Upload a List of Search Engine Keywords
Upload a List of Search Engine Keyword Additions
Upload a List of Search Engine Keyword Deletions
Reporting screen
Reporting screen
Report Configuration window
Report Configuration
Specify the Reporting Device
Edit ER Server Information
8e6 Enterprise Reporter
View Transfer Activity to the ER
Execute Log Transfer Now
Enter or Edit Server Information
Other Device
295
View Transfer Activity to the Reporting Device
Real Time Probe window
Real Time Probe
Set up Real Time Probes
Enable Real Time Probes
Exclude an IP Address from Real Time Probing
Remove IPs from the White List
Report Recipients
Specify Email File Criteria
Remove Email Addresses
Set up Email Addresses to Receive Reports
Real Time Probe window, Logon Accounts tab
Set up Users Authorized to Create Probes
302
Go to Real Time Probe Reports GUI
Re-login window
Create a Real Time Probe
Real Time Probe Reports
305
Enter the Total Run Time in Minutes
11 Real Time Probe Reports, View tab
View Real Time Probe Details
12 Real Time Information box
View option
13 Probe Properties box
Properties option
Email option
Stop, Delete options
Group Administrator Section
312
Group screen, IP menu
Refresh the Master IP Group, Member
Group screen, master IP group menu
Master IP Group
Group Details window
Change the Group Administrator Password
Add the IP Address of the Member
Members window
Remove a Member from the Group
Override Account window
319
Override Account pop-up window, Rule tab
321
322
Override Account pop-up window, Redirect tab
Override Account pop-up window, Filter Options tab
325
326
327
10 Group Profile window, Profile tab
Group Profile window
329
330
11 Group Profile window, Redirect URL tab
Redirect URL
12 Group Profile window, Filter Options tab
333
Custom Categories, see Library screen, URL Keywords window
13 Exception URL window
Exception URL window
ByPass URL frame
Block URL frame
Add a Time Profile
Time Profile window
15 Adding Time Profile
339
340
341
342
17 Time Profile pop-up window, Rule tab
18 Time Profile pop-up window, Redirect URL tab
19 Time Profile pop-up window, Filter Options tab
20 Time Profile pop-up window, Exception tab
Exception URL
347
Delete a Time Profile
Modify a Time Profile
21 Upload/Download IP Profile window
Upload/Download IP Profile window
22 Upload IP Profiles pop-up window
Upload IP Profiles
23 Download IP Profiles window
Download Profile
Add an IP Sub Group
Add Sub Group
Add an Individual IP Member
Add Individual IP
Delete a Master IP Group Profile
Delete Group
Paste a Copied IP Sub Group
Paste Sub Group
27 Group screen, Sub Group menu
Sub Group
View IP Sub-Group Details
Sub Group IP Group window
29 Sub Group IP Group window, fields activated
Add IP Sub-Group Details
30 Members window
Modify Sub-Group Members
Sub Group Profile window
Delete an IP Sub-Group
Delete Sub Group
Copy an IP Sub-Group
Copy Sub Group
31 Group screen, Individual IP menu
Individual IP
Enter the IP Address of the Member
Member window
Individual IP Profile window
Delete an Individual IP Member
Delete Individual IP
367
Library Lookup window
Look up a URL
Look up a Search Engine Keyword
Library screen, custom library category menu
Custom Categories
Library Details window
View, Edit Library Details
URLs window, Action tab
URLs window, View tab
Add or Remove URLs or Wildcard URLs
376
377
Upload a Master List of URLs
Upload a Master List to the Library
Library File Content/IP Lookup Options
Upload Custom Library WildCard URL window
Upload a Master List of Wildcard URLs
10 Library File Content/IP Lookup Options
382
11 URL Keywords window
384
12 Upload Library Keyword pop-up window
13 Search Engine Keywords window
387
Upload a Master List of Search Engine Keywords
Delete a Custom Category
Delete Category
Hours
Technical Support
Contact Information
8e6 Corporate Headquarters USA
Office Locations and Phone Numbers
8e6 Taiwan
392
Support Procedures
Product Warranties
Standard Warranty
394
Technical Support and Service
Extended Technical Support and Service
Extended Warranty optional
Filtering Profile Format and Rules
Appendix a
Filter Mode Values
Port command codes
Rule Criteria
Port Numbers
Category Codes
Category command codes
Quota format
Filter Option codes
Traveler Log Messages
Appendix B
System Command Execution
Command Executed More than Once
General Activity
Startup, Finish
Library Download Process
Printstack Trace
Library Update Process
Customer Feedback Module Option
Error Messages
Summary Messages
Weekly Update 7 Days Library
All Library Updates includes all other msgs
Full URL Library Update URLs, URL Keywords
IM and P2P Pattern File Update
Newsgroup Library Update News
Emergency Update
Patch Update
Search Engine Keywords Library Update
Appendix C
Enable block page redirection
Create a Custom Block
Part I Modify the ProxyBlocker
Option 2 Modify the ProxyBlocker console
Exclude filtering server for block page IP
Part II Customize the Block
Set up a Web server
Create a customized block
Show 8e6’s information in the block page optional
Implement the further option optional
Part III Restart the ProxyBlocker
Customized block page examples
Html
Reference
413
Embed data in query string
CGI written in Perl
CGI
Use Java Script to post form data
Print body\n
Entries20
CGI written in C
Entriesindex.val = char *fmakewordstdin, &, &datasize
419
Ifurlx = urly == %
421
Return Void getquerychar *paramd, char **paramv
Override Pop-up Blockers
Appendix D
Yahoo! Toolbar Pop-up Blocker
If Pop-up Blocking is Enabled
Add Override Account to the White List
Fig. D-3 Allow pop-ups from source
Google Toolbar Pop-up Blocker
Fig. D-4 # blocked icon enabled
AdwareSafe Pop-up Blocker
Temporarily Disable Pop-up Blocking
Fig. D-6 Mozilla Firefox Popup Windows Preferences
Mozilla Firefox Pop-up Blocker
Windows XP SP2 Pop-up Blocker
Set up Pop-up Blocking
Use the Internet Options dialog box
Use the IE Toolbar
Fig. D-8 Toolbar setup
Fig. D-9 Pop-up Blocker Settings
Access your Override Account
Set up the Information Bar
Use the Information Bar
Click the Information Bar for settings options
Entries in the ProxyBlocker Admin console
Configure ProxyBlocker for ER Reporting
Appendix E
Fig. E-2 Report Configuration window, Log tab
Entries in the ER Administrator console
Appendix F
RAID Maintenance
Part 1 Hardware Components
Part 2 Server Interface
LED indicators in SL units
LED
Color Condition Description Indicator
Front control panels on SL units
441
Hard drive failure
Part 3 Troubleshooting
Review the notification email
Fig. F-2 Hardware Failure Detection window
Verify the failed drive in the Admin console
Replace the failed hard drive
Identify the failed power supply
Power supply failure
Unplug the power cord
Rebuild the hard drive
Replace the failed power supply
Identify a fan failure
Fan failure
Glossary
Appendix H
449
450
451
452
453
454
Numerics
Index
456
FTP
IP 14, 245 types
459
460
NAT
P2P
463
464
465
Traveler 2, 254, 274, 400 definition
Wildcard 266, 277, 280, 369, 373, 376 window, terminology
468