E9300/1B and H Power Sensor Specifications
% Error |
|
|
|
|
|
|
1 |
|
|
|
|
|
|
0.8 |
|
|
|
|
|
|
0.6 |
|
|
|
|
|
|
0.4 |
|
|
|
|
|
|
0.2 |
|
|
|
|
|
|
0 |
|
|
|
|
|
|
|
|
|
|
|
| |
|
|
|
|
|
| |
|
|
|
|
|
| |
|
|
|
|
|
| |
|
|
|
|
|
| |
0 | 10 | 20 | 30 |
Power Level (dBm)
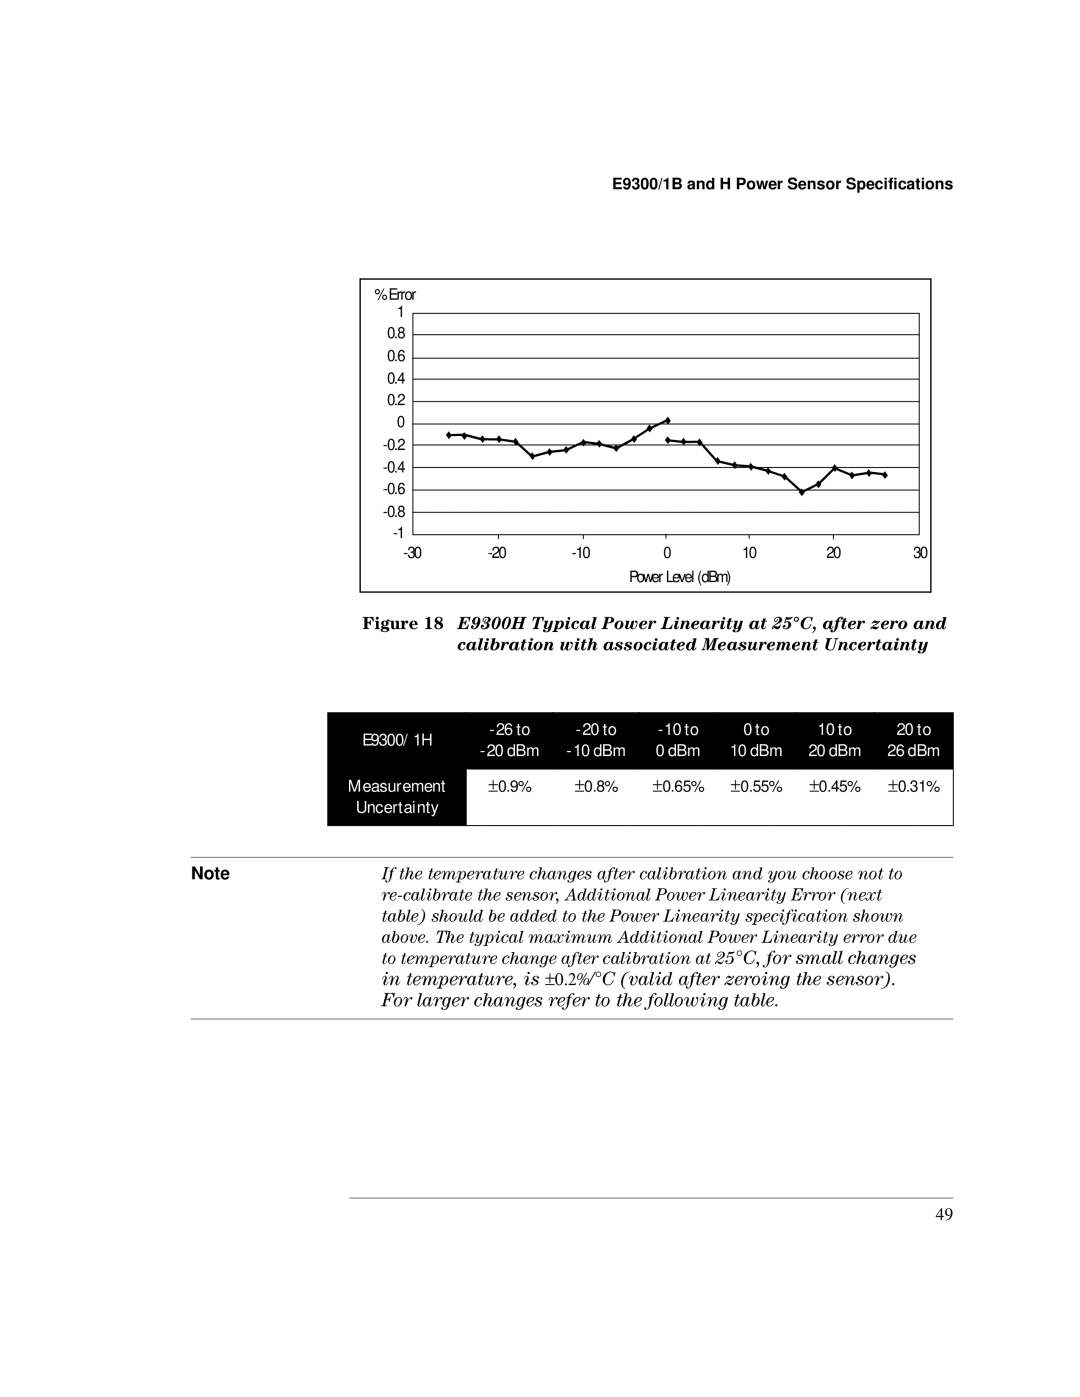
Figure 18 E9300H Typical Power Linearity at 25°C, after zero and
|
| calibration with associated Measurement Uncertainty | |||||||
|
|
|
|
|
|
|
|
|
|
| E9300/1H |
| 0 to | 10 to |
| 20 to | |||
|
| 0 dBm | 10 dBm | 20 dBm |
| 26 dBm | |||
|
|
|
| ||||||
|
|
|
|
|
|
|
|
|
|
| Measurement |
| ± 0.9% | ± 0.8% | ± 0.65% | ± 0.55% | ± 0.45% |
| ± 0.31% |
| Uncertainty |
|
|
|
|
|
|
|
|
|
|
|
|
|
|
|
|
| |
|
|
|
|
|
|
|
|
|
|
Note | If the temperature changes after calibration and you choose not to | ||||||||
|
| ||||||||
| table) should be added to the Power Linearity specification shown | ||||||||
above. The typical maximum Additional Power Linearity error due to temperature change after calibration at 25°C, for small changes in temperature, is ±0.2 %/°C (valid after zeroing the sensor).
For larger changes refer to the following table.
49