Management
Viewing Statistics
Statistics for a SuperStack II Switch 1000, one of its VLAN groups, or one of its ports can be viewed in two different formats: table or graph. Sta- tistics collected include runts, alignment errors, collisions, short events, and readable frames.
Table Statistics
1 To view statistics for the SuperStack II Switch 1000, do not select anything on the Device Page’s front panel image.
To view statistics for a VLAN group, click once on a port belonging to that VLAN group.
To view statistics for a port, click on the port until it is highlighted with a green box.
ΔNote: For more information about selecting a VLAN group, see “Selecting a VLAN Group for Man- agement” on page
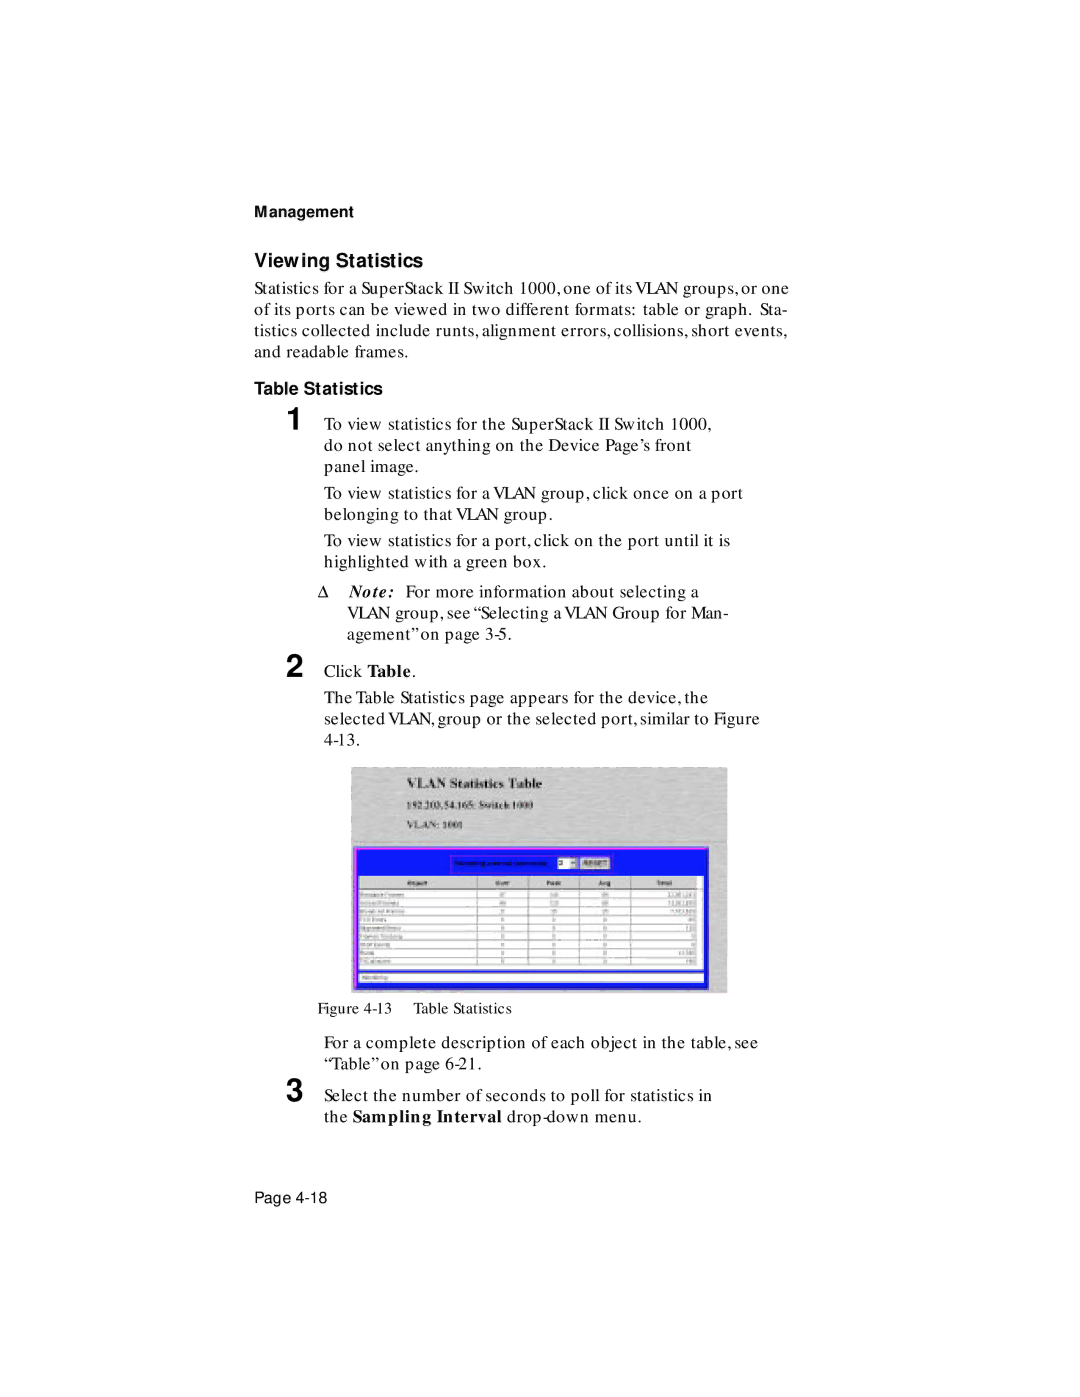
2 Click Table.
The Table Statistics page appears for the device, the selected VLAN, group or the selected port, similar to Figure
Figure 4-13 Table Statistics
For a complete description of each object in the table, see “Table” on page
3 Select the number of seconds to poll for statistics in the Sampling Interval
Page