Management
Graph Statistics
1 To view statistics for the SuperStack II Switch 1000, do not select anything on the Device Page’s front panel image.
To view statistics for a VLAN group, click once on a port belonging to that VLAN group.
To view statistics for a port, click on the port until it is highlighted with a green box.
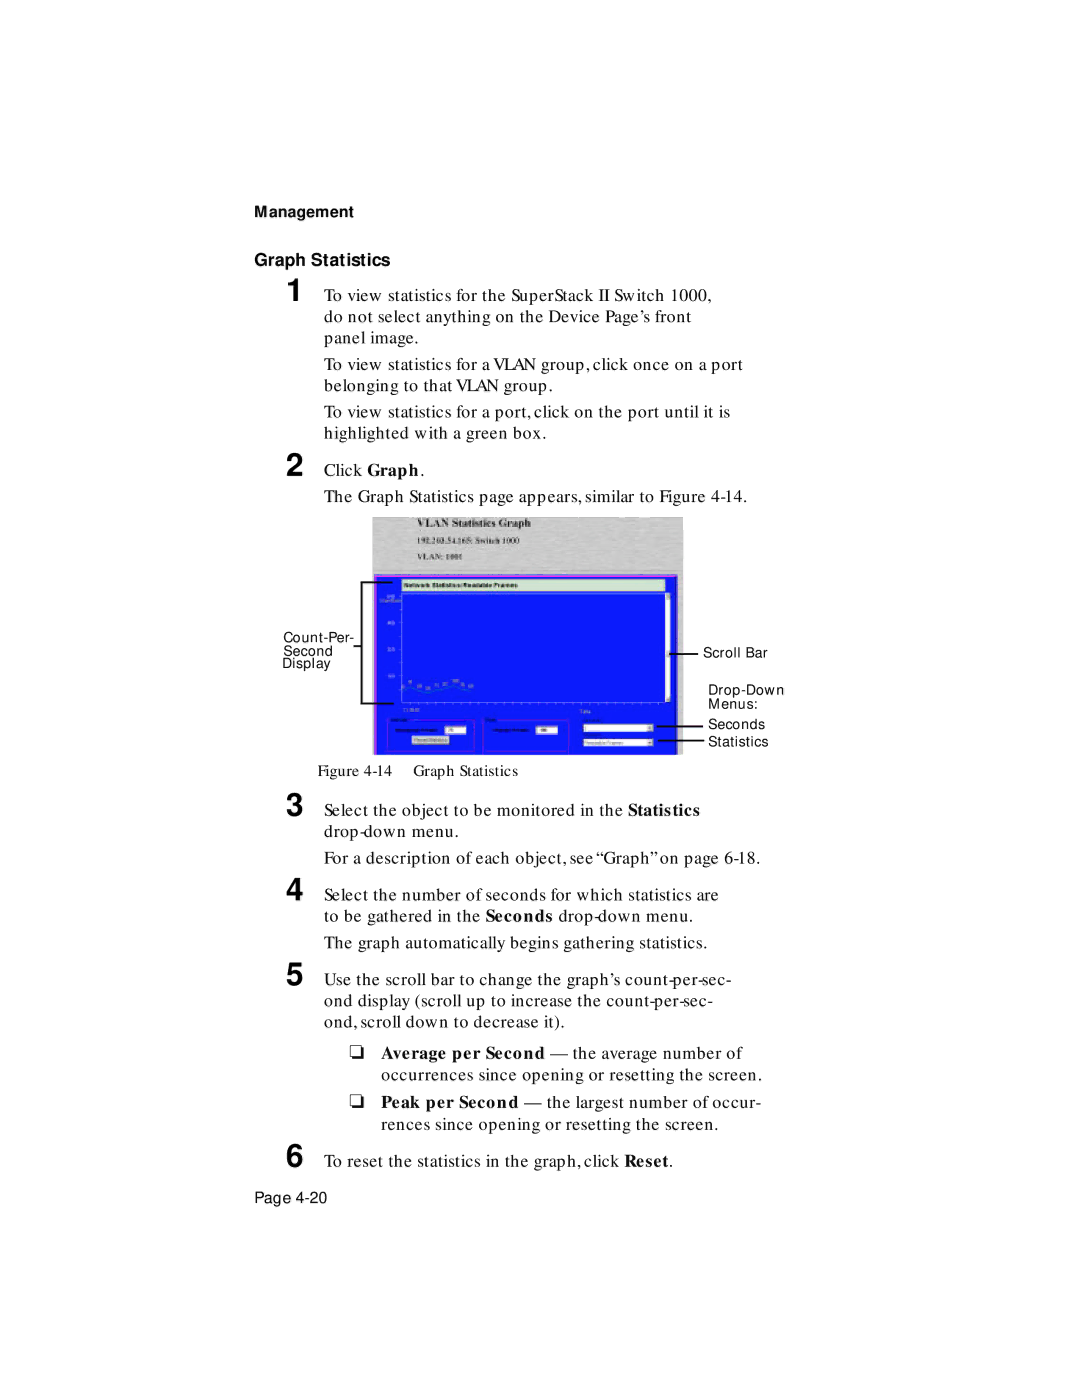
2 Click Graph.
The Graph Statistics page appears, similar to Figure
Second
Display
Scroll Bar
Menus:
Seconds
Statistics
Figure 4-14 Graph Statistics
3
4
Select the object to be monitored in the Statistics
For a description of each object, see “Graph” on page
Select the number of seconds for which statistics are to be gathered in the Seconds
The graph automatically begins gathering statistics.
5 Use the scroll bar to change the graph’s
❏Average per Second — the average number of occurrences since opening or resetting the screen.
❏Peak per Second — the largest number of occur- rences since opening or resetting the screen.
6 To reset the statistics in the graph, click Reset.
Page