9E312/9E423 Module Bridging
Performance Graphs
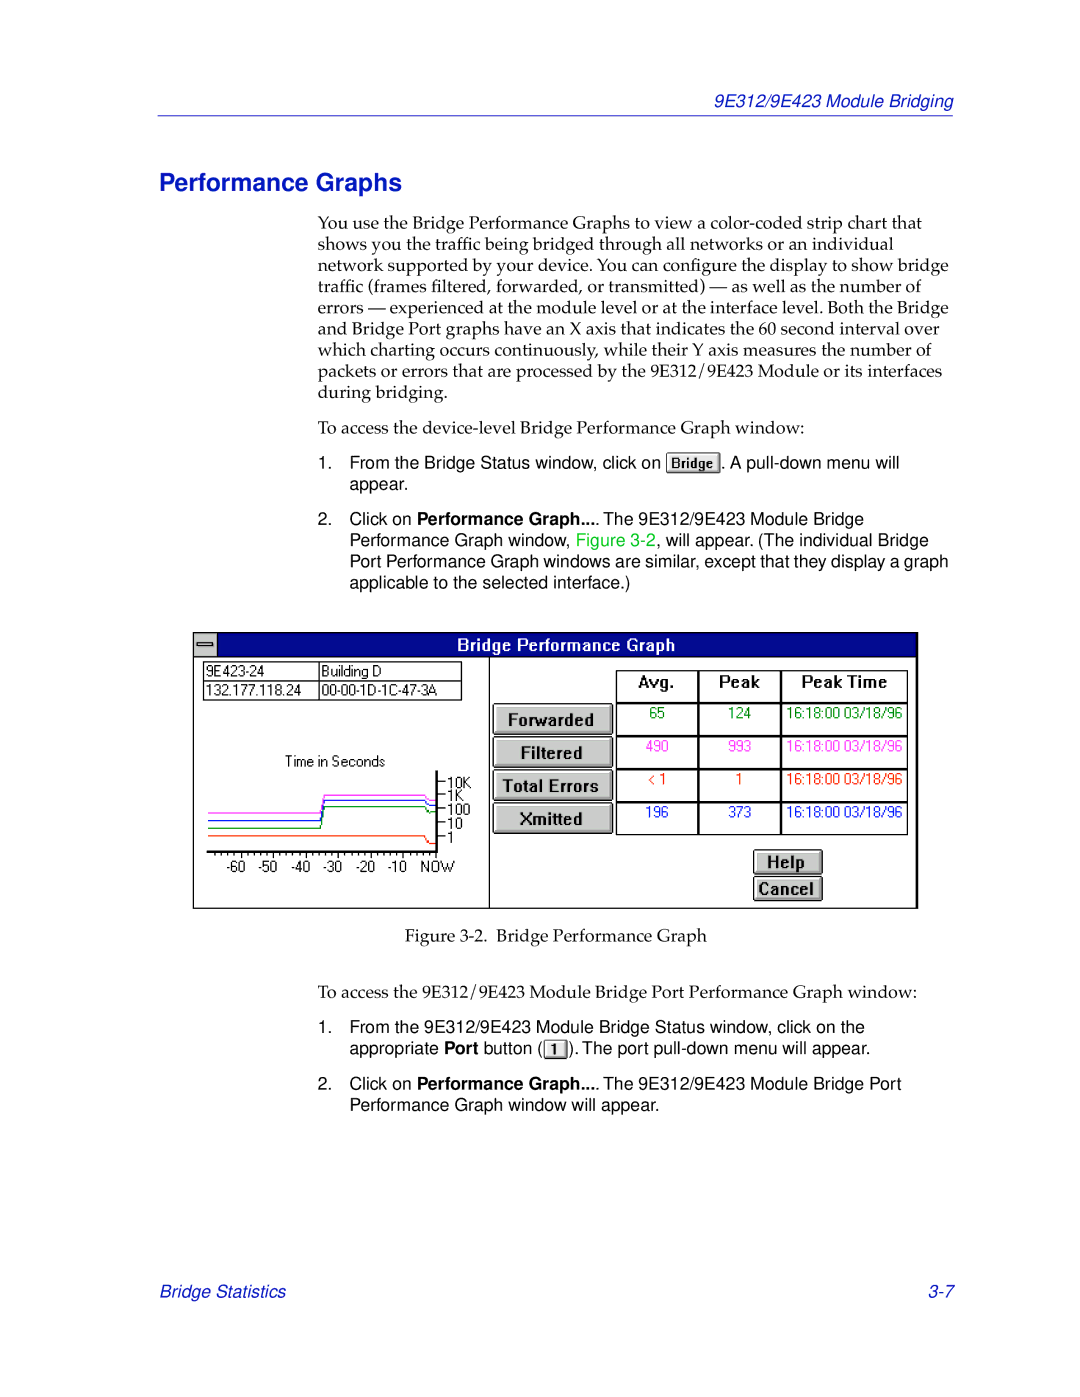
You use the Bridge Performance Graphs to view a color-coded strip chart that shows you the traffic being bridged through all networks or an individual network supported by your device. You can configure the display to show bridge traffic (frames filtered, forwarded, or transmitted) — as well as the number of errors — experienced at the module level or at the interface level. Both the Bridge and Bridge Port graphs have an X axis that indicates the 60 second interval over which charting occurs continuously, while their Y axis measures the number of packets or errors that are processed by the 9E312/9E423 Module or its interfaces during bridging.
To access the device-level Bridge Performance Graph window:
1.From the Bridge Status window, click on  . A pull-down menu will appear.
2.Click on Performance Graph.... The 9E312/9E423 Module Bridge Performance Graph window, Figure 3-2, will appear. (The individual Bridge Port Performance Graph windows are similar, except that they display a graph applicable to the selected interface.)
Figure 3-2. Bridge Performance Graph
To access the 9E312/9E423 Module Bridge Port Performance Graph window:
1.From the 9E312/9E423 Module Bridge Status window, click on the appropriate Port button ( ). The port pull-down menu will appear.
2.Click on Performance Graph.... The 9E312/9E423 Module Bridge Port Performance Graph window will appear.