|
|
|
| |
|
|
|
|
|
b. Optical Preamplifier Adjustments |
| |||
Step |
| Action |
| Indication |
No. |
|
| ||
|
|
|
| |
14 |
|
|
|
|
|
|
| RTA |
|
Cat. No. 240 |
|
|
| |
|
|
| IN |
|
Proj. 1 | Status |
|
|
|
RV101 | Gain | L |
|
|
RV102 hf |
|
| ||
|
|
| ||
RV201 | Gain | R |
|
|
RV202 hf |
|
| ||
|
|
| ||
TP501 L tp |
| X |
| |
| L | SIGNAL |
|
|
|
|
|
| |
|
| PRESENT | Y |
|
| R |
|
| |
|
|
|
| |
TP502 R tp |
|
|
| |
RV301 Gain | L |
|
| |
RV302 hf | R |
|
| |
RV401 Gain | SCOPE | dB | ||
RV402 hf | ||||
Proj. 2 | Status |
|
| +10 |
|
|
| ||
TP503 GND
+5
INTO | ✓ |
FOCUS |
0
REPEAT | 12 AND 13 | |
|
|
OUT OF
FOCUS X
.05 |
| .1 |
| .2 |
| .4 |
| .8 |
| 1.6 |
| 3.15 |
| 6.3 |
| 12.5 |
| kHz |
15
dB +10
+5 |
| ✓ |
|
|
|
|
|
|
|
| 0 |
Cat. No. |
|
|
|
|
|
|
|
|
| |
240A |
|
|
|
|
|
|
|
|
| |
|
|
|
|
|
|
|
|
|
| |
| .05 | .1 | .2 | .4 | .8 | 1.6 | 3.15 | 6.3 | 12.5 | kHz |
Proj. 1 |
|
|
|
|
|
|
|
|
|
|
GAIN |
|
|
|
|
|
|
|
|
|
|
Lt |
|
|
|
|
|
|
|
|
| dB |
hf |
|
|
|
|
|
|
|
|
| +10 |
GAIN |
|
|
|
|
|
|
|
|
|
|
Rt |
|
|
|
|
|
|
|
|
|
|
hf |
|
|
|
|
|
|
|
|
|
|
Lt tp |
|
|
|
|
|
|
|
|
| +5 |
|
|
|
|
|
|
|
|
|
|
| Lt | X |
|
|
|
|
|
|
|
|
signal |
|
|
|
|
|
|
|
| 0 | |
|
|
|
|
|
|
|
|
| ||
present |
|
|
|
|
|
|
|
|
| |
| Rt |
|
|
|
|
|
|
|
|
|
Rt | tp |
|
|
|
|
|
|
|
| |
|
|
|
|
|
|
|
|
| ||
GAIN |
|
|
|
|
|
|
|
|
| |
Lt | hf |
|
|
|
|
|
|
|
| |
|
|
|
|
|
|
|
|
|
| |
GAIN | .05 | .1 | .2 | .4 | .8 | 1.6 | 3.15 | 6.3 | 12.5 kHz | |
|
|
|
|
|
|
|
|
| ||
Rt | hf |
|
|
|
|
|
|
|
|
|
|
|
|
|
|
|
|
|
|
| |
Proj. 2 |
|
|
|
|
|
|
|
| dB | |
gnd |
|
|
|
|
|
|
|
| ||
|
|
|
|
|
|
|
| +10 | ||
|
|
|
|
|
|
|
|
|
| |
+5 |
X0
.05 |
| .1 |
| .2 |
| .4 |
| .8 |
| 1.6 |
| 3.15 |
| 6.3 |
| 12.5 |
| kHz |
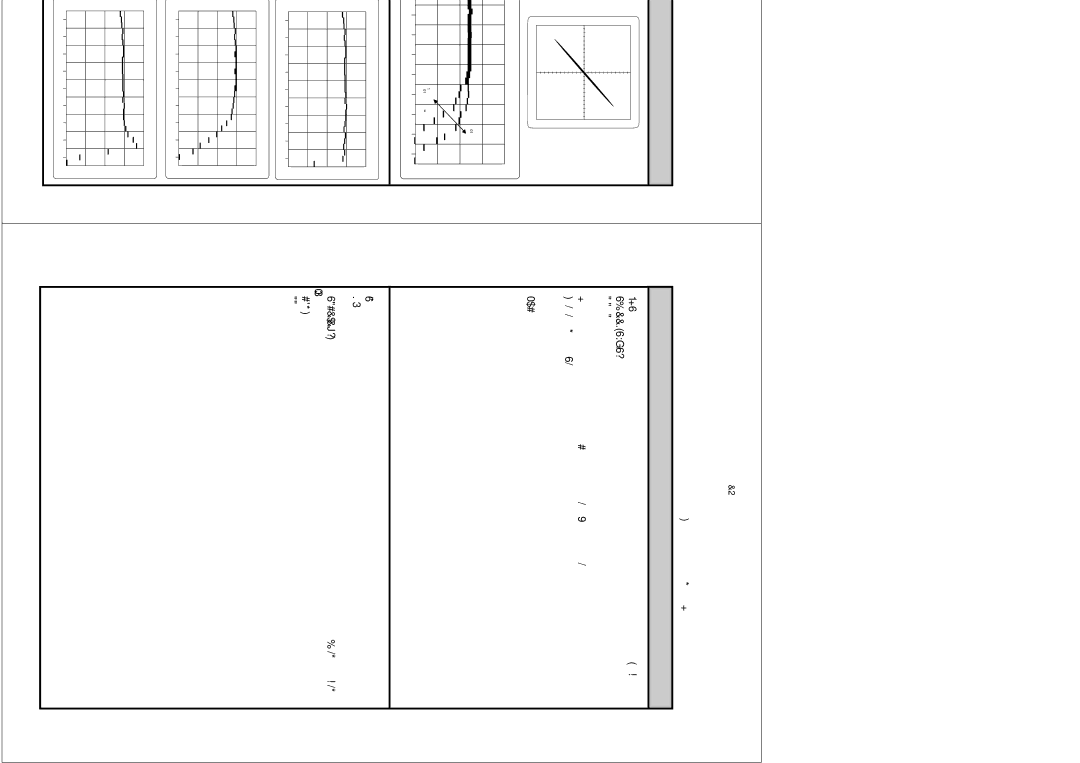
b. Optical Preamplifier Adjustments
Notes
Disconnect the RTA from the left test point and connect it to the right test point TP502 R. Then repeat Steps 12 and 13. NOTE: The azimuth and high frequency response must be the same at both the left and right test points. If results are not similar, it may be necessary to remove the lens and check for oil or contamination or a degraded slit. Replace the lens, if necessary. Do not proceed to the next step until the outputs at both the left and right test points are similar.
Appendix B shows the effects of slit geometry on frequency response.
The test in this step is performed both at the right and left channel test points of the Cat. No. 240A card.
The frequency response must be within 1 dB to at least 12 kHz. Adjust the L hf and R hf potentiometers on the Cat. No. 240A card for the most extended high frequency response without “peaking.” If these adjustments do not improve the frequency response, the problem may be a degraded slit or damage to the lens.