Chapter 4 Feature and Function Reference
Waveform Edit Windows
dxu uvy s xyq uqytu4 d sxq u qsyv t ysq
III | v u Zu Oq4 |
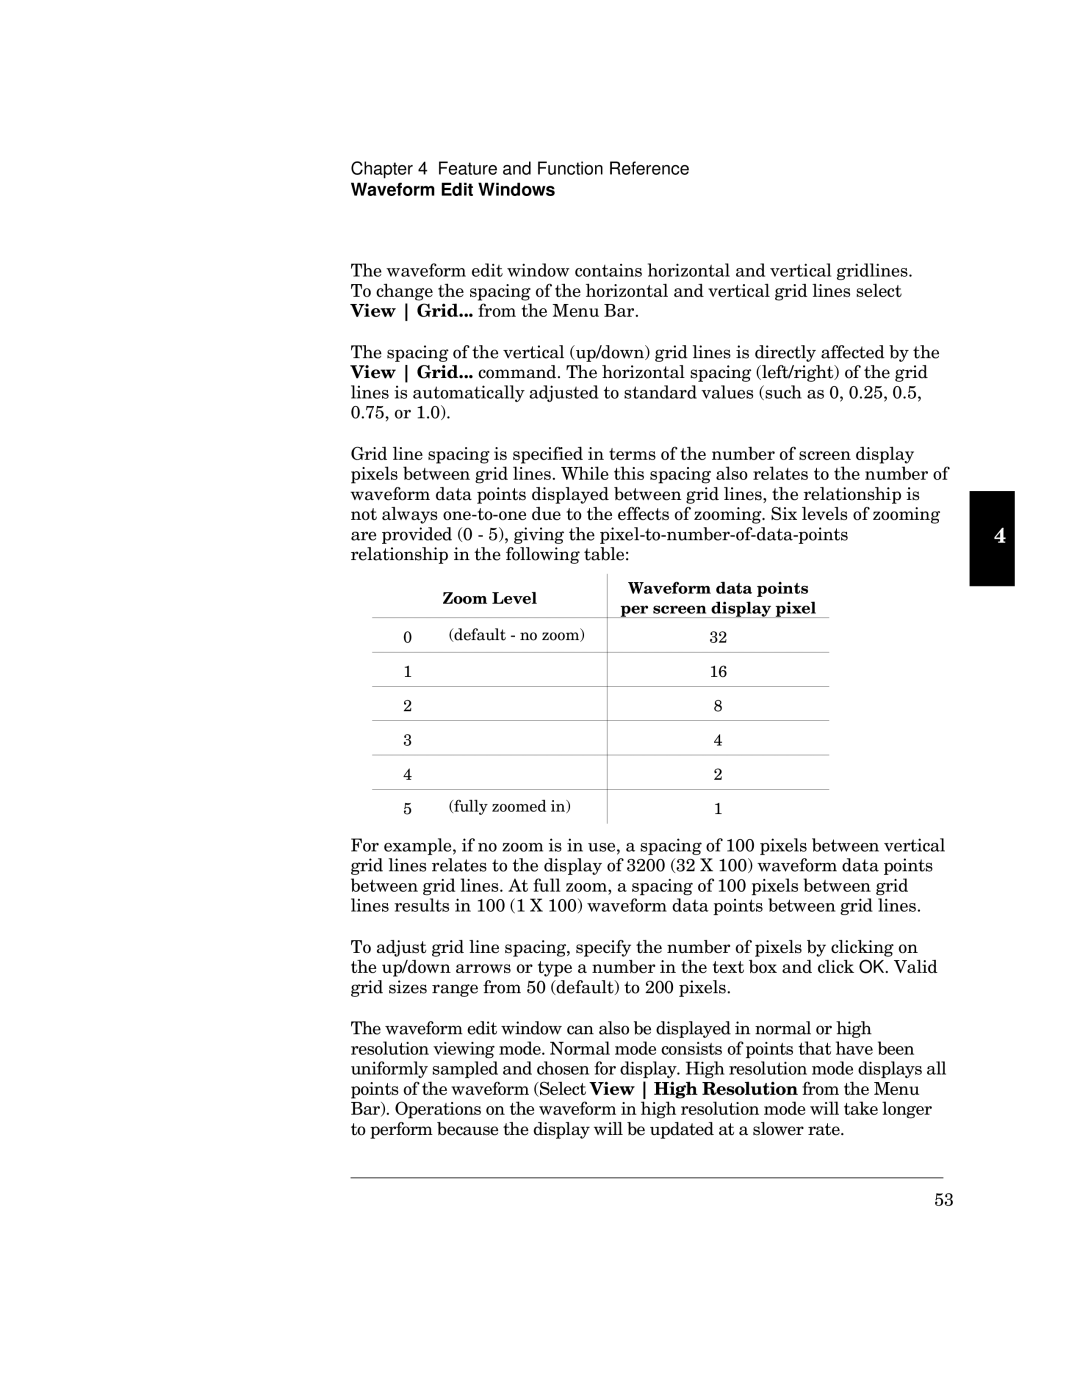
dxu qsyv uq5t wyt u y tyvusut r u
IIIst4 dxu xqsyuvywx u w yzt q qu .x q
64CA2 746/4
Tyt u qsy usyvyut yv v s ty |
|
|
| ||||
yu 4 gxyqsyw q u v |
|
|
| ||||
qv tqy tyut ruuu wyt u2 xy y |
|
|
| ||||
|
|
| |||||
q u vvusv yv |
|
|
|
| R | ||
qytut .6 3 A/2 wyy3ru33tqy |
|
| |||||
xy y F |
|
|
|
|
|
| |
|
|
|
|
|
|
| |
|
|
|
|
|
|
|
|
|
|
|
|
|
|
|
|
|
| 6 | .tuvq / |
| 98 |
|
|
|
|
|
|
|
|
|
|
|
| 7 |
|
| 7B | ||
|
|
|
|
|
|
|
|
|
| 8 |
|
| D | ||
|
|
|
|
|
|
|
|
|
| 9 |
|
| : |
|
|
|
|
|
|
|
|
|
|
|
| : |
|
| 8 |
|
|
|
|
|
|
|
|
|
|
|
| A | .v ut y/ |
| 7 |
|
|
|
|
|
|
|
|
| |
Squ2 yv | y 2 q qsyv 766 yuysq |
|
|
| |||
wyt u | u ty | 9866 .98 h 766/ qv tqy |
|
|
| ||
ruu 4 N2 q qsyv 766 yu |
|
|
| ||||
u7 h 766/ qv tqy ruuu wyt u4 |
|
|
| ||||
d qtzyt u qsyusyv v y sw |
|
|
| ||||
5t q u q yu | r qt s |
| OK4 fq | ||||
wyt wu v A6 .tuvq y |
|
|
| ||||
dxu uty sqqqq xywx |
|
|
| ||||
yw \q tu s xq xquu |
|
|
| ||||
v ut qt sxvqUywx ytu tyq |
|
|
| ||||
us |
| w | vxu Zu | ||||
Oq _yxu yytu rusqxu ty ru q q
A9